RSI FWA Divergence Indicator
Platform: MT4 Type: Pattern Last update: August 3, 2024The RSI FWA Divergence indicator for MT4 scans and displays divergences between price and the RSI indicator.
That gauge is capable of recognizing both bullish and bearish divergences. You can successfully utilize low-risk trend reversal trading in both bullish and bearish markets.
How does it work? How to apply in trading?
Signals provided by the RSI FWA Divergence Indicator are really intuitive and will not cause you difficulties. Simply follow the suggestions below.
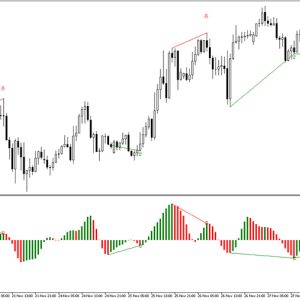
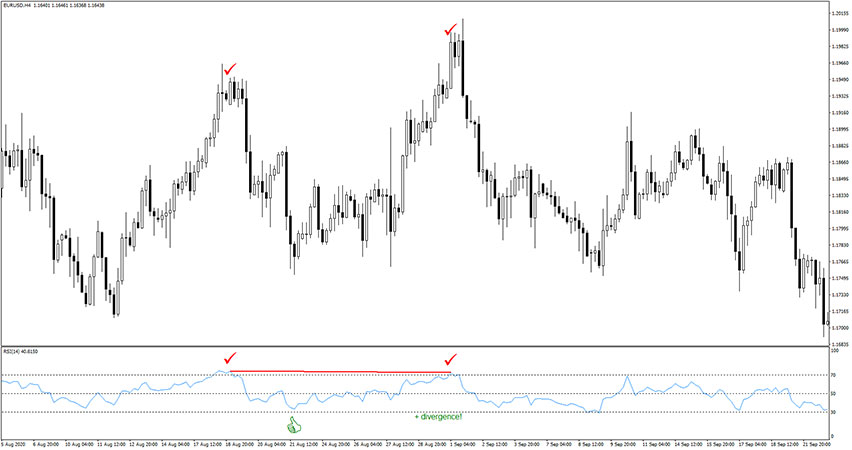
Buy Entry: A buy entry point (long trade) occurs when the RSI FWA Divergence indicator provides recognized bullish divergence below the 50 level. You will see a divergence line drawn in conjunction with check marks. Place your stop loss a few pips below the last swing low.
Sell Entry: A sell entry point (short trade) occurs when the RSI FWA Divergence indicator provides recognized bearish divergence above the 50 level. You will see a divergence line drawn in conjunction with check marks. Place your stop loss a few pips above the swing high.
Exit Trade / Take Profit: Close your open position when the RSI reaches 70 level for buy or 30 level for sell, or use your own preferred method of trade exit.
As always, to achieve good results, remember about proper money management. To be a profitable trader you need to master discipline, emotions, and psychology. It is crucial to know when to trade, but also when not to trade. Avoid trading during unfavorable times and market conditions like low volume/volatility conditions, beyond major sessions, exotic currency pairs, wider spread, etc.
Example of AUD/CAD H1 Chart
This screenshot below shows an example of the RSI FWA Divergence Indicator in action.