RSI HTF Indicator MT5
Platform: MT5 Type: Oscillator Last update: June 22, 2025The RSI HTF Indicator for MT5 is an interesting variation of the famous Relative Strength Index.
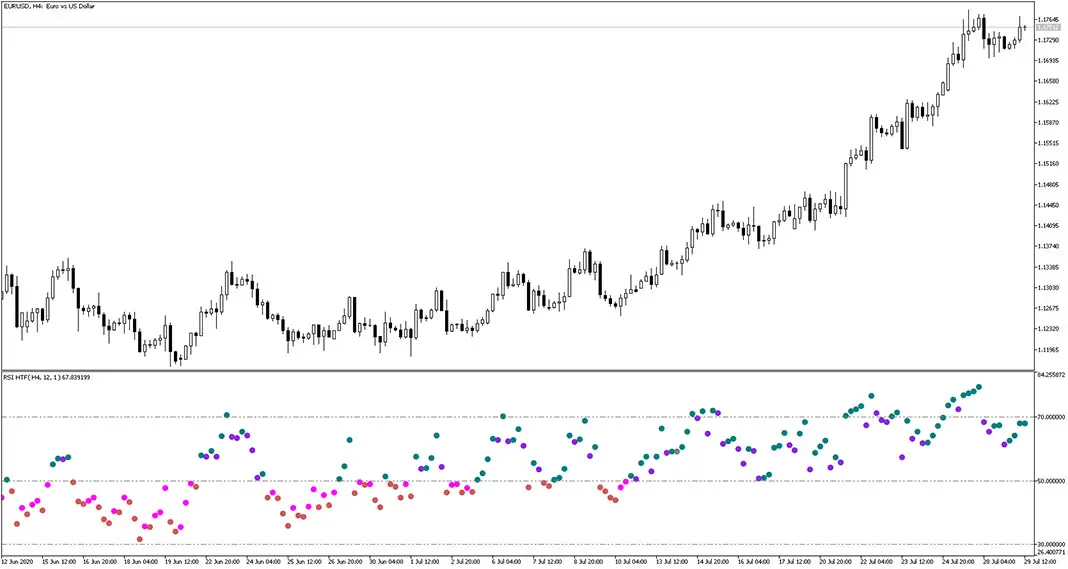
This version provides signals in the form of colorful dots instead of the traditional oscillator line. The dots appear red in the lower section and green in the upper section, with the separation line at the 50 value level.
Example chart:

How to use the rsi htf indicator for mt5?
When you take a closer look, you’ll notice four main colors: green, violet, brown, and pink. Bright colors indicate rising (ascending) values, while darker shades suggest falling RSI signals.
You can apply standard technical analysis techniques, such as identifying divergences or drawing trendlines by connecting the dots. Additionally, the indicator supports higher timeframe analysis (hence “HTF” in the name), which you can configure in the settings tab.
Indicator settings
There are four customizable inputs in the settings tab.
- Chart period – timeframe from which the RSI data will be drawn
- RSI period – number of periods used to calculate the RSI value (e.g. 14)
- Price constant – which price type is used for the RSI calculation (e.g. close, open, high, low)
- Repeat display of information in the empty bars – controls whether dots are shown for bars with no price data
Submit your review | |