RSI Triple Stochastic Divergence Indicator

RSI Triple Stochastic Divergence Indicator for MT4

Introduction to the RSI Triple Stochastic Divergence Indicator

The RSI Triple Stochastic Divergence indicator is a marvelous buy/sell signals indicator that is based on the Relative Strenght Index (RSI) and a custom Triple Stochastic technical indicator.

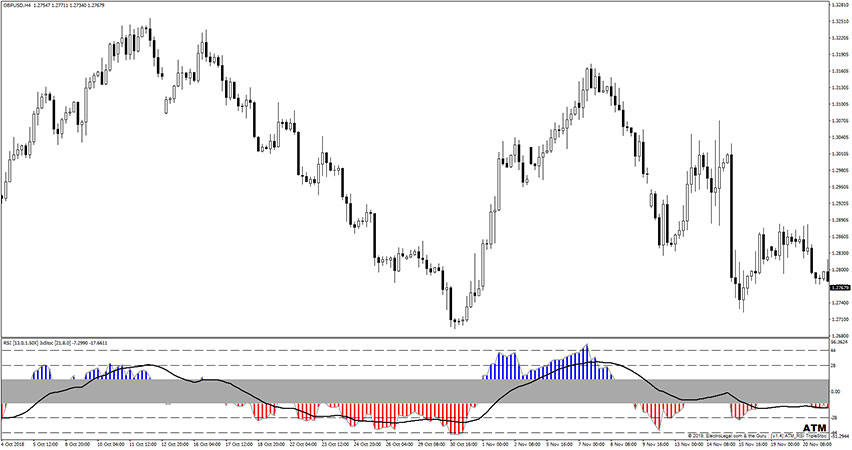
The values provided by that gauge fluctuates between two extreme values: 28 and -28. There is a special gray zone in between, that works as a filter. This zone reduces noise and false signals significantly, making the actual signals much more accurate and reliable.

The RSI Triple Stochastic Divergence indicator is a pretty universal trading tool and works for scalping, swing trading, and day trading purposes.

It fits all kinds of timeframes and currency pairs.

The indicator is displayed in a separate window placed just below the main trading chart.

The default settings can be modified directly from the input tab. Feel free to experiment with the settings and parameters to fit your personal preferences.

How does it work? How to apply in trading?

Trading Rules Explanation

Signals provided by the RSI Triple Stochastic Divergence Indicator are really intuitive and will not cause you difficulties. Simply follow the suggestions below.

Buy Entry: Open long trade after the RSI Triple Stochastic Divergence indicator blue bar exceeds the 28 value or/and leaves the gray area. Optionally, the black line shouldn’t leave that gray area yet, otherwise, the signal is a bit late. Place your stop loss a few pips below the last swing low.

Sell Entry: Open short trade after the RSI Triple Stochastic Divergence indicator red bar drops below the -28 value or/and leaves the gray area. Optionally, the black line shouldn’t leave that gray area yet, otherwise, the signal is a bit late. Place your stop loss a few pips above the swing high.

Exit Trade / Take Profit: That forex indicator itself doesn’t provide exit signals on its own, so use your own preferred method of trade exit. Some ideas you can get are using pivot points, support and resistance levels, oscillators, etc.

As always, to achieve good results, remember about proper money management. To be a profitable trader you need to master discipline, emotions, and psychology. It is crucial to know when to trade, but also when not to trade. Avoid trading during unfavorable times and market conditions like low volume/volatility conditions, beyond major sessions, exotic currency pairs, wider spread, etc.

Example of EUR/AUD M30 Chart

This screenshot below shows an example of the RSI Triple Stochastic Divergence Indicator in action.

RSI Triple Stochastic Divergence Indicator in action.

How to set up the RSI Triple Stochastic Divergence indicator in MT4?

Installation Guide

Copy and paste the RSI HistoTripleStoch.ex4 or RSI HistoTripleStoch.mq4 indicator files into the MQL4 folder of the Metatrader 4 trading platform.

You can gain access to this folder by clicking the top menu options, which goes as follows:

File > Open Data Folder > MQL4 > Indicators (paste here).

Now go to the left side of your MT4 terminal. In the Navigator find the gauge name, right-click it and select Attach to the chart.

Bottom Line

The RSI Triple Stochastic Divergence indicator is well worth adding to your trading collection but remember about having realistic expectations. Just like any other technical analysis tool, is not capable of providing accurate signals 100% of the time. Thus, this forex indicator provides false signals occasionally. Its performance will vary significantly depending on market conditions. Feel free to develop your own trading system based around it.

RSI Triple Stochastic Divergence Indicator Free Download

To download the RSI Triple Stochastic Divergence Indicator for Metatrader 4 (MT4) for free just click the button below:

RSI Triple Stochastic Divergence Indicator Free Download

Tags: , ,