Introduction to the RSI (Var) Hull of Hull Indicator
Before we start explaining the RSI (Var) Hull of Hull Indicator, you should know that the Relative Strenght Index (RSI) uses for its calculations something called Wilders EMA. Replacing that Moving Average with some other type results in a totally different version of RSI comparing the original RSI.
As the name suggests, this gauge uses Alan Hull’s Moving Average for the following things:
- to replace the Wilders EMA with Hull average
- and to add price filtering prior to calculation
The RSI (Var) Hull of Hull Indicator fits all kinds of timeframes and currency pairs. It is displayed in a separate window placed just below the main trading chart. The default settings can be modified directly from the input tab. Feel free to experiment with the settings and parameters to fit your personal preferences.
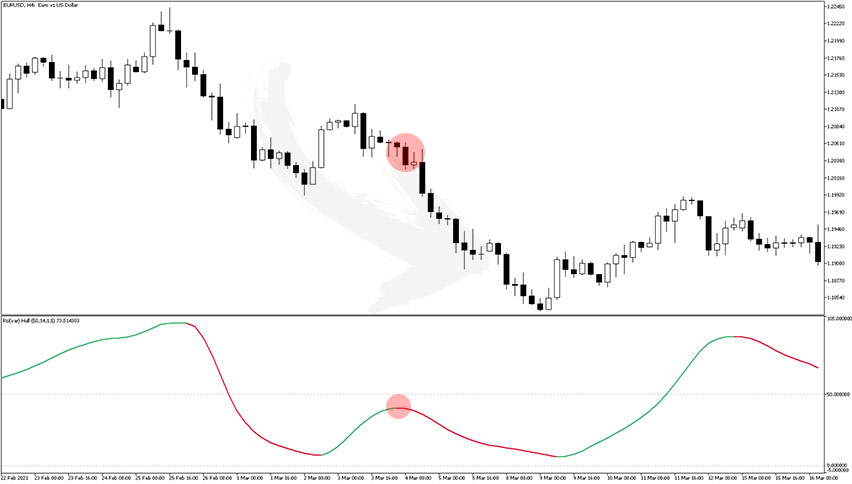
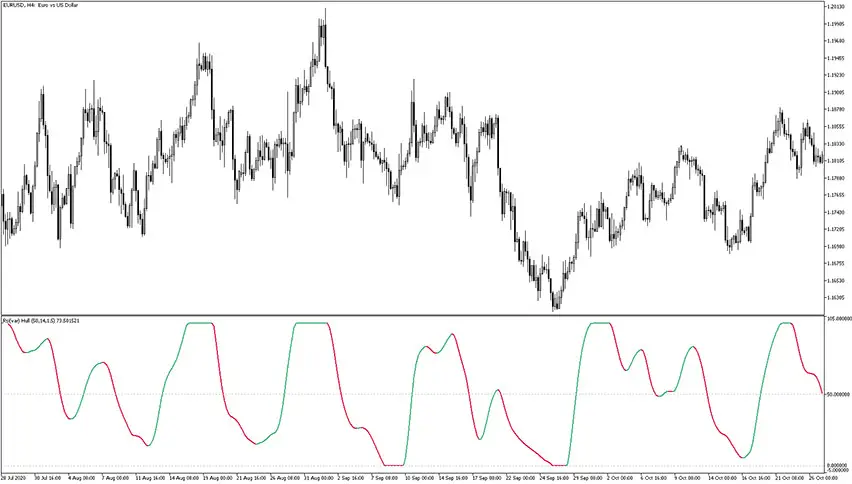
Anatomy of the RSI (Var) Hull of Hull Average Indicator
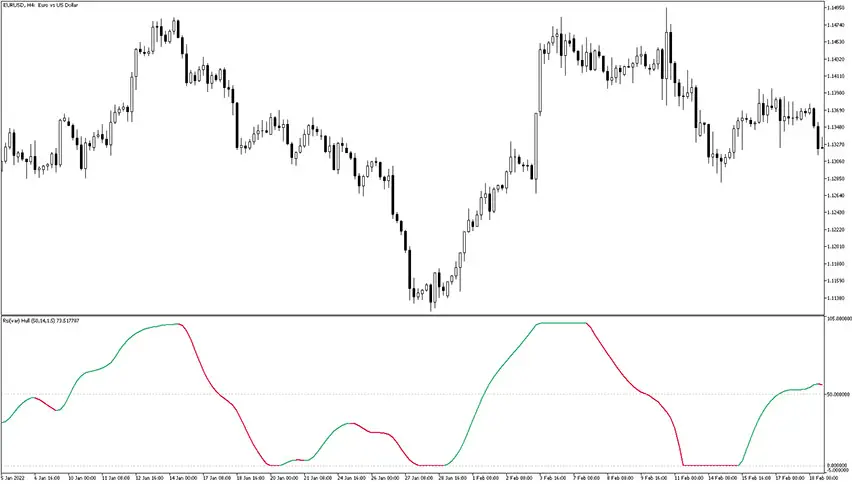
The RSI (Var) Hull of Hull Average Indicator is just an oscillating line that is additionally colored red and green depending on the ongoing signal. As you can probably guess, the red color indicates a bearish signal, and conversely, the green color indicates a bullish signal. You can also pay attention to the 50 level. When the line is above that value it means the overall market is considered bullish. Similarly, the values drop below that, suggesting an overall bearish market.
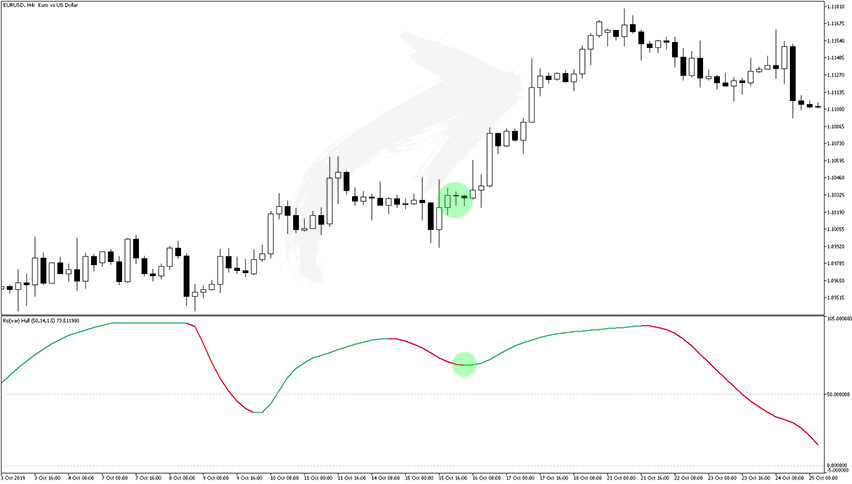
RSI (Var) Hull of Hull Average: Buy Signal
Follow these steps for a long trade:
- The oscillator line is above the 50 level
- The color of the line changes from red to green
- Open buy order after the color change and triggering candle gets closeed
- Set stop loss a few pips below the most recent market low point
- Take profit after reaching positive risk to reward ratio or when line changes color
RSI (Var) Hull of Hull Average: Sell Signal
Follow these steps for a short trade:
- The oscillator line is below the 50 level
- The color of the line changes from green to red
- Open sell order after the color change and triggering candle gets closeed
- Set stop loss a few pips above the most recent market high point
- Take profit after reaching positive risk to reward ratio or when line changes color
How to set up the RSI (Var) Hull of Hull Average indicator in MetaTrader (MT5)?
Installation Guide
Download the RSI (Var) Hull of Hull Average.rar archive at the bottom of this post, unpack it, then copy and paste the RSI (Var) Hull of Hull Average.ex5 or RSI (Var) Hull of Hull Average.mq5 indicator files into the MQL5 folder of the Metatrader 5 trading platform.
You can gain access to this folder by clicking the top menu options, which goes as follows:
File > Open Data Folder > MQL5 > Indicators (paste here).
Now go to the left side of your MT5 terminal. In the Navigator find the gauge name, right-click it and select Attach to the chart.
Summary Of That Forex Indicator
The RSI (Var) Hull of Hull Average indicator is well worth adding to your trading collection. A good forex indicator will most probably enhance your chance of success. Nonetheless, remember about having realistic expectations. Just like any other technical analysis tool, is not capable of providing accurate signals 100% of the time. Thus, this forex indicator provides false signals occasionally. Its performance will vary significantly depending on market conditions. Feel free to develop your own trading system based around it. Don’t forget that we still have more great free forex indicators to try.
Download Free Forex MT5 RSI (Var) Hull of Hull Average Indicator
To download the RSI (Var) Hull of Hull Averagel Indicator for Metatrader 5 (MT5) for free just click the button below:
RSI (Var) Hull of Hull Average Indicator Free Download