Support and Resistance Indicator
MT5 Free DownloadIntroduction to the Support and Resistance Indicator
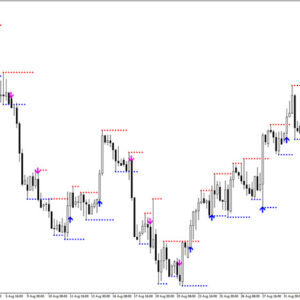
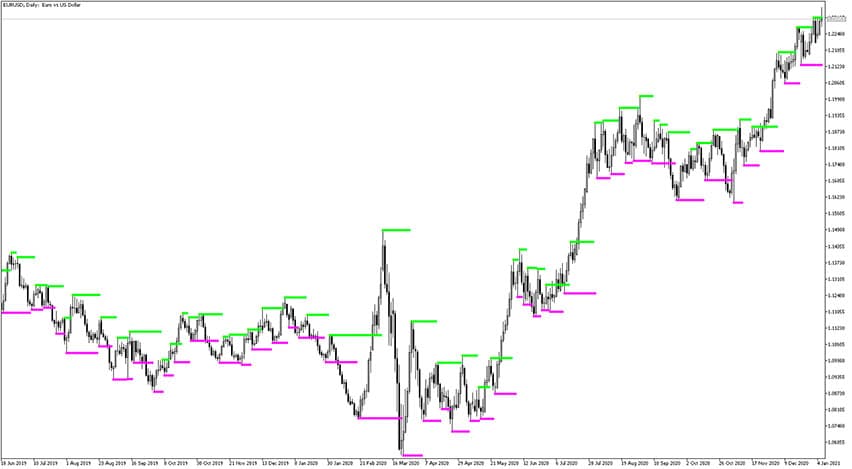
The Support and Resistance indicator for MT5 displays the support and resistance levels using the Fractals indicator.
The calculation of support levels is based on the “Fractals down”, and the calculation of the resistance levels is based on the “Fractals up” of the Fractals indicator by Bill Williams.
These levels are shown in the form of magenta and green dots. The lime green color dots work as resistance. Similarly, the magnet dots work as support. In other words, the magenta dots offer buying signals and the lime green dots are used for selling signals.
Please note that these signals should be treated just like additional filters, not standalone core buy/sell signals.
The default indicator settings can be modified directly from the input tab. Feel free to experiment with the settings and parameters to fit your personal preferences.
How to set up the Support and Resistance indicator in MT5?
Installation Guide
Copy and paste the Support_and_Resistance.mq5 or Support_and_Resistance.ex5 indicator files into the MQL5 folder of the Metatrader 5 trading platform.
You can gain access to this folder by clicking the top menu options, which goes as follows:
File > Open Data Folder > MQL5 > Indicators (paste here).
Now go to the left side of your MT5 terminal. In the Navigator find the gauge name, right-click it and select Attach to the chart.
Bottom Line
The Support and Resistance indicator is well worth adding to your trading collection but remember about having realistic expectations. It should be not used as a standalone tool for your trading decisions, but it will be a perfect fit for your favorite strategy as an S&R filter. Pay attention to the price action, reactions at these levels: bounces and breakouts.
Support and Resistance Indicator Free Download
To download the Support and Resistance Indicator for Metatrader 5 (MT5) for free just click the button below:
Support and Resistance Indicator Free Download
