
Category: Forex MT4 Indicators
Dynamic Cycle Explorer Indicator

The Dynamic Cycle Explorer Indicator is a custom forex trading tool that utilizes the swing trading technique. The signals provided by this forex indicator are based on crossovers. Additionally, it gives buy/sell arrows for trade entries and exits. Using the Dynamic Cycle Explorer in practice Signals provided by the Dynamic Cycle Explorer are really intuitive […]
UF2018 Indicator

The UF2018 Indicator for MT4 is typically used for determination of general market’s trend. The readings are quite basic, as it just displays orange and blue bars. The orange bars reflect a bearish trend, and similarly, the blue bars reflect a bullish trend. It should be used rather as a filter than a standalone signal […]
AFStar Indicator

The AFStar Indicator for MetaTrader 4 is essentially a buy/sell arrows gauge. It could be a good supplement to your trading system and confirmation of trade entry points and exit points. You can use this tool as a short-term swing levels recognizer. Further testing proved that it may slightly repaint past bars, but not much, […]
Candle Direction Indicator

The Candle Direction Indicator for MT4 provides information for each time frame whether current bar is bullish, bearish or neutral. In the top left corner of the chart there are red, green or white squares tagged with corresponding tf. This data allows traders to see bigger picture and to understand what is going on with […]
Three Line Break Indicator

The Three Line Break Indicator for MT4 is focused purely on price movements and do not consider the time factor. The starting point is about price action and trends, filtering smaller fluctuactions. In the result it’s easier for trades to identify significant changes. This method is named after the number of lines usually used to […]
Stochastic Elasticity Indicator

The Stochastic Elasticity Indicator is a forex trading tool that tries to predict a change in price direction. The higher bar occurs, the higher probability of trade reversal is underway. You can use it to support your trade entry points and exit decisions. Example chart:
Cristal Ball Signal Indicator

The Cristal Ball Signal Indicator for MT4 is a forex trading tool that colorizes candlesticks to dark blue and dark green. These colors reflect market trends. While there are blue candles look for buying trade opportunities. Similarly, when there are red candles look for selling trade opportunities. Example chart:
Price EMAs Indicator

The Price EMAs Indicator for MT4 displays the distance between the open price and 3 different periods exponential moving averages (EMAs) in pips. The default periods of MAs are 10, 50, and 200. The general idea behind that gauge is to define market trends and the formula is pretty simple. When the green MA is […]
Forecasting Indicator

The Forecasting Indicator for MT4 tries to predict market moves in the nearest future. On the right side of your chart, you will notice the pinkish line that reflects the next potential price movement. Of course, it’s not a crystal ball, so don’t follow provided signals blindly. Rather use it together with other technical analysis […]
STO JMA Indicator
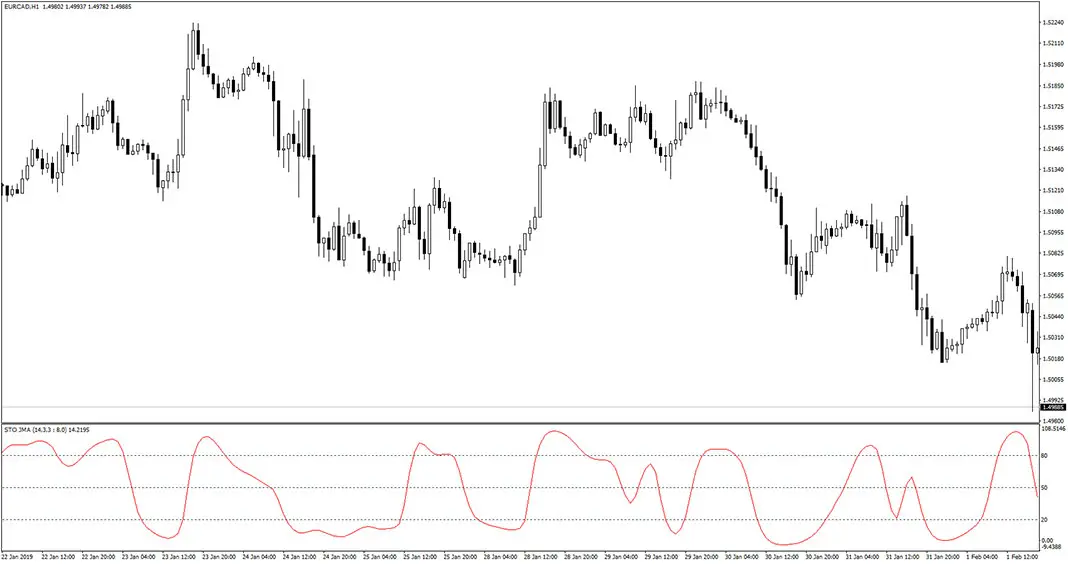
The STO JMA Indicator for MT4 is a custom oscillator that shows overbought and oversold market levels. Example chart: How to use the STO JMA Indicator for MT4? When that STO JMA signal line reaches below 20 level, it suggests the price is oversold. This scenario means you should be looking for a buy trade […]
