Category: Channel Indicators
JMA Keltner Channel Indicator
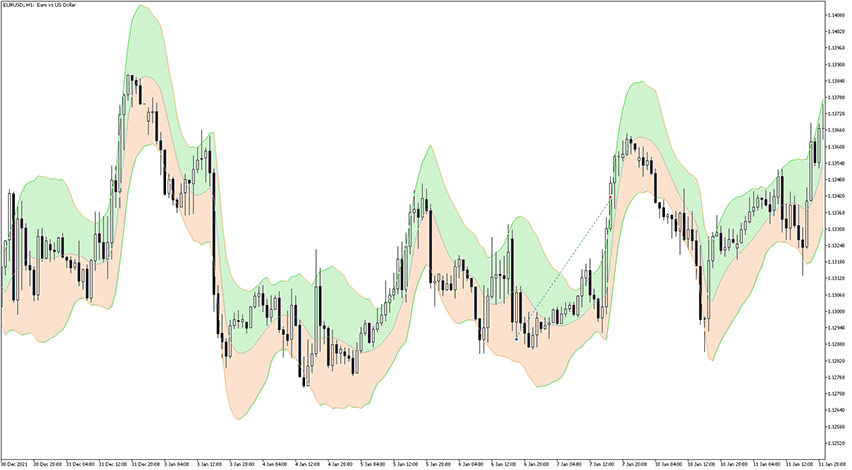
The JMA Keltner Channel Indicator for MT5 is a variation of the standard Keltner Channel indicator, but this one is based on Jurik Moving Average. The Keltner Channel is usually calculated as SMA (Simple Moving Average) +- ATR distance for the bands. Since SMA is the slowest moving average, that version uses a much “faster” […]
Keltner Channel Indicator
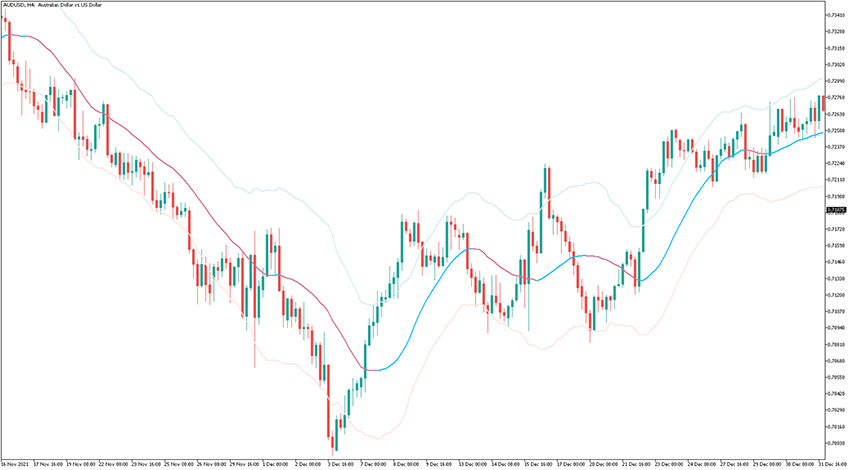
The Keltner Channel Indicator for MetaTrader 5 is named after Chester Keltner who first introduced his indicator in his 1960 book “How to make money in Commodities“. The original indicator was based on the 10-period moving average, and this one can be set to both simple moving average and exponential moving average. It consists of […]
Auto Trend Channel Indicator MT5
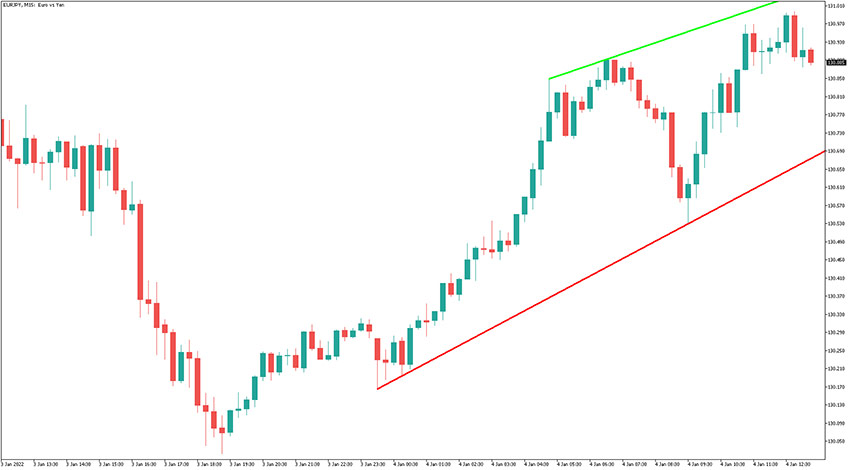
The Auto Trend Channel Indicator for MT5 analyzes price points and automatically draws trendlines that form a price channel. These trendlines act as dynamic support and resistance levels. Example chart: How to use the Auto Trend Channel Indicator for MetaTrader 5? The idea behind trading with the auto trend channel indicator is about how price […]
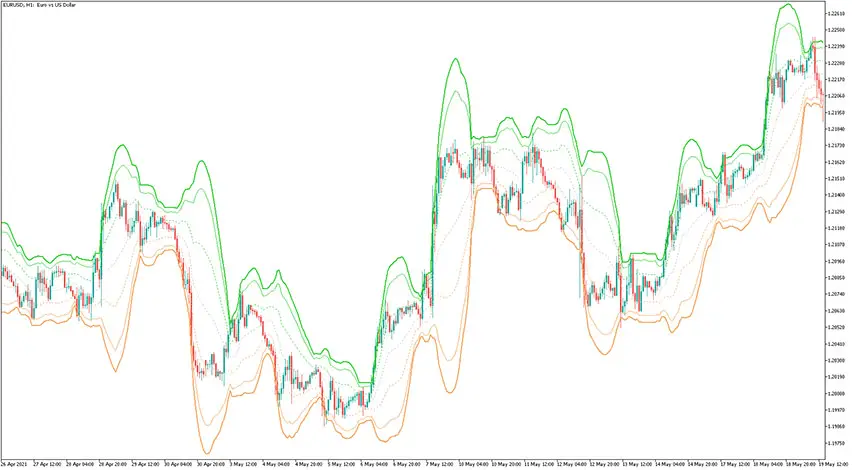
Keltner Channel Smooth ATR Indicator

The Keltner Channel Smooth ATR Indicator for MetaTrader 5 is a volatility-based envelope that is aligned above and below a Moving Average, which is a central element of that indicator. In the settings of that Keltner Channel indicator, you can set the median value average method among the: Exponential Moving Average, Simple Moving Average, Smoothed […]
Standard Deviation Channels X3 Cloud Indicator
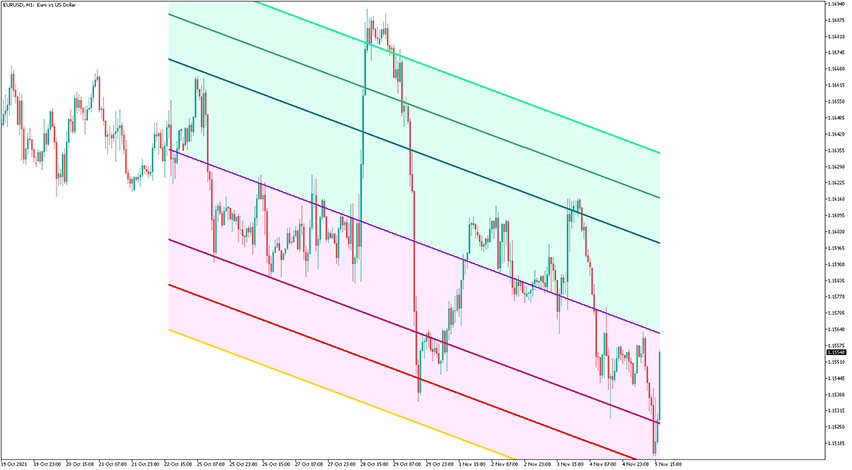
The name of the Standard Deviation Channels X3 Cloud Indicator for MT5 pretty much defines what it is. It plots a channel (with three extensions to top and bottom) based on the Standard Deviation indicator. The violet trendline is a middle line of the channel. First, check the slope of the channel whenever it’s upward […]
Channel on Parabolic Indicator
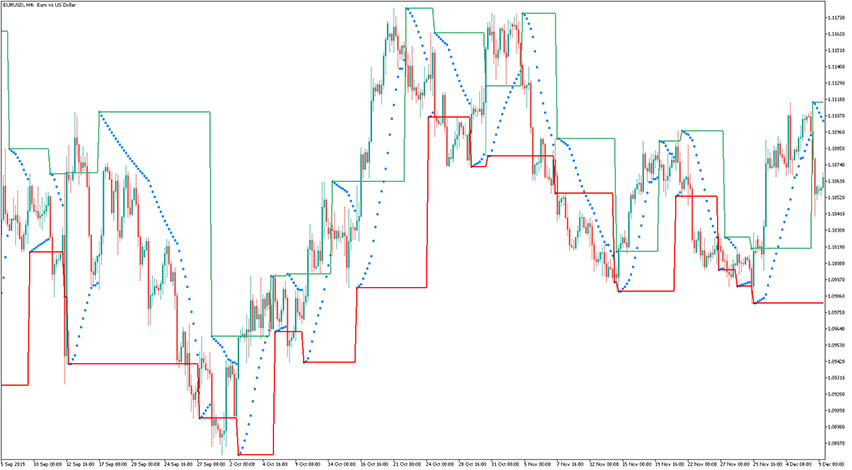
The Channel on Parabolic Indicator for MT5 combines a price channel and Parabolic Sar indicator into one trading tool. Granted that the price constantly moves within channel bands, a trader should look for buy trade opportunities when the price hits red bands and the entry is confirmed with Parabolic Sar dots to switch location from […]
3X Parabolic Regression Indicator
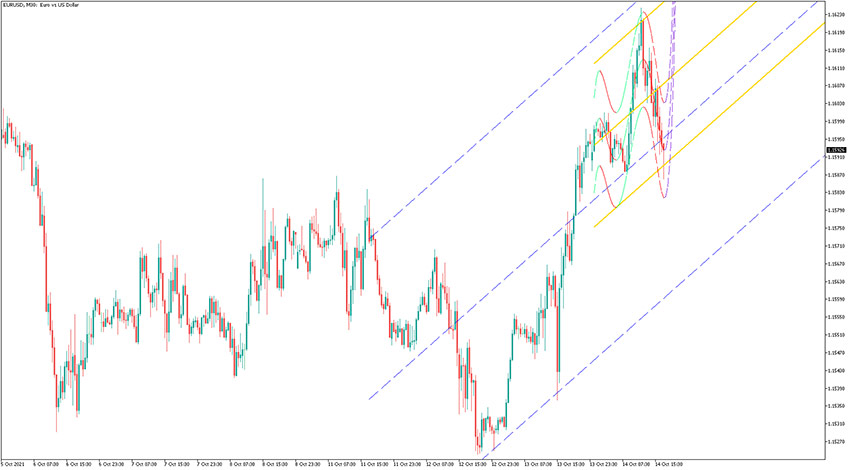
The 3X Parabolic Regression Indicator draws two linear trend channels calculated on the standard deviation (with different periods) and a single curvilinear trend channel calculated on a parabolic regression. How to apply 3X Parabolic Regression in trading? As we mentioned at the beginning of this article, the 3X Parabolic Regression Indicator consists of three channels. […]
VWAP Bands Indicator
The VWAP Bands Indicator for MetaTrader 5 is similar to the Bollinger Bands, but to calculate its values it uses Volume-Weighted Average as the central value of the bands. Additionally, you can choose an option to use the tick volume or real volume for calculation (only in the case, if the symbol and the broker […]
Point of Balance (POB) Indicator
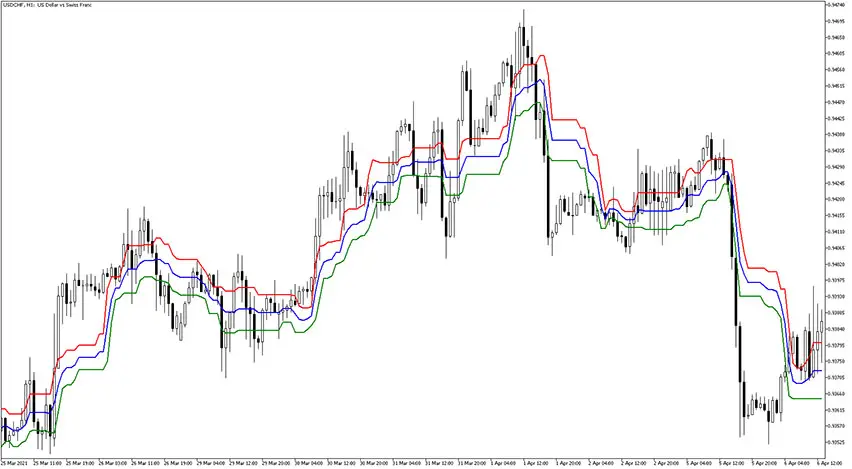
The Point of Balance (POB) indicator lays a triple line channel that serves as the current trend revealer. The price and candlestick move above/below that channel. It consists of three lines: the red and green lines are aligned to the upper outer and lower outer boundaries of the channel respectively, while the blue line stays […]
RSI Slope Divergence Indicator MTF
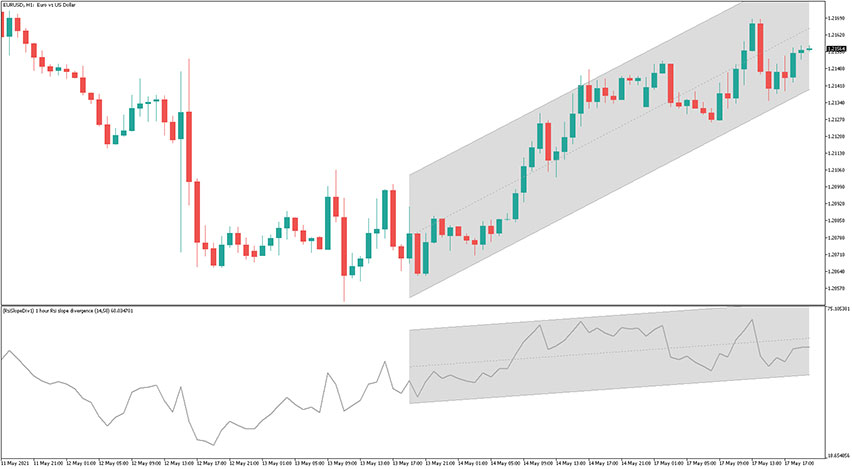
The RSI Slope Divergence indicator MTF plots two linear regression channels: directly on the price and on the Relative Strength Index (RSI). It is a multi-timeframe indicator. The general usage of that gauge is divergences detection, but also correction or retracement even before it occurs.