Category: Momentum Indicators
MACD Histogram Indicator MT5
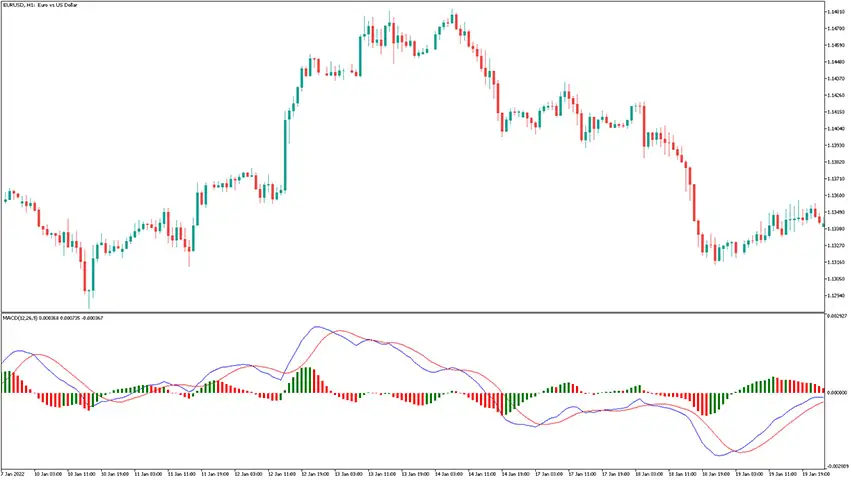
The MACD Histogram Indicator for MT5 is responsible for showing the difference between the MACD line and signal line. Additionally, the histogram bars make it easy to see when bulls or bears are gaining control of the market. How to use the macd histogram indicator for mt5? A quick glance of an eye is enough […]
Wajdyss Ichimoku Candle Alert Indicator
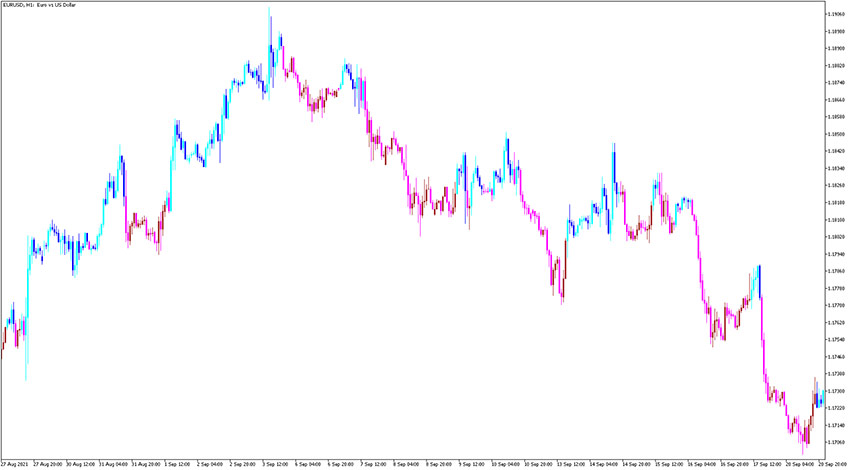
The Wajdyss Ichimoku Candle Alert Indicator uses Ichimoku Kinko Hyo to calculate its values. That indicator colorize candlesticks according to the trend-momentum – the blueish candles indicate bullish market momentum, and the redish candles reflect bearish market momentum.
MACD 2 Line Indicator MT5
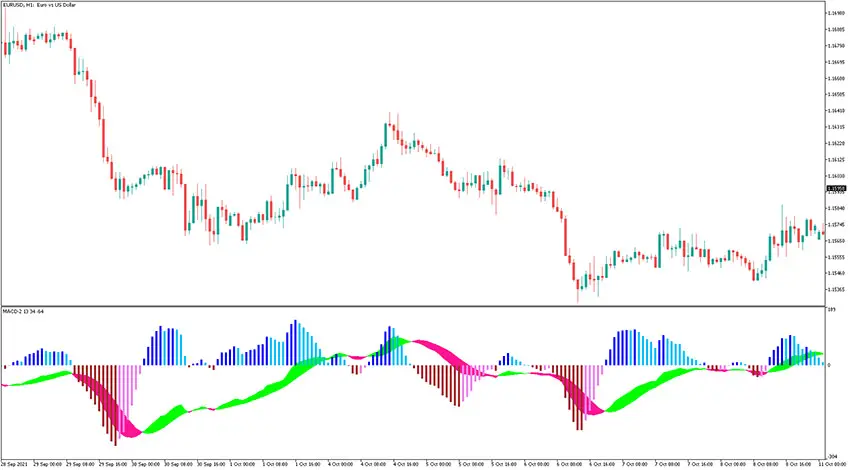
The MACD 2 Line Indicator for MT5 is an enhanced version of this classic momentum indicator and it has two lines that form a cloud. This change makes it easier to visualize crossovers that reflect potential short-term trend reversals. Example chart: How to use the macd 2 line indicator for mt5? The macd 2 line […]
MACD Parabolic SAR Indicator
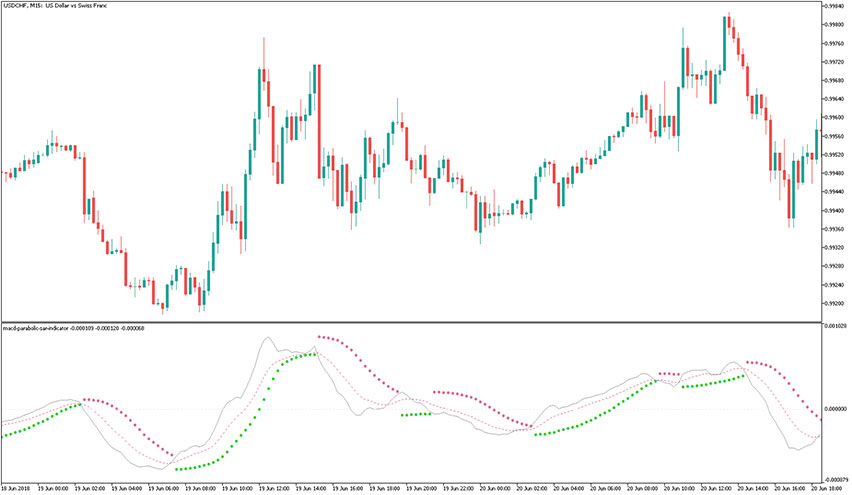
The MACD Parabolic SAR Indicator is, as the name suggests, a combination of Moving Average Convergence Divergence and Parabolic SAR. Both forex indicators are well-known and appreciated by traders around the world. Making a single forex indicator out of these two results in a highly-effective trading tool. How to apply the MACD Parabolic SAR in […]
SRange Contraction Indicator
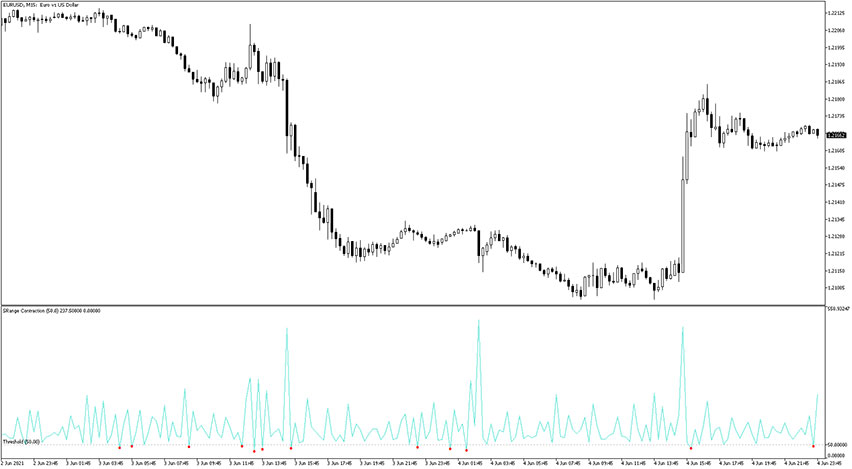
The SRange Contraction indicator calculates the ratio between today’s and the previous day’s ranges and displays these values. When the previous day’s range is tighter than the day before, this could suggest a potential explosive momentum today according to Toby Crabel. An alert pointer (red dot) gets marked along with the narrow range points (under […]
Intraday Momentum Index Indicator
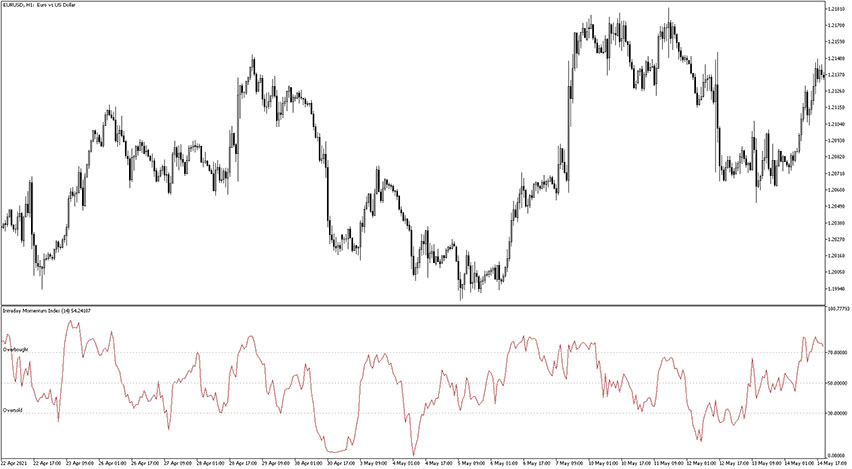
The Intraday Momentum Index indicator is an oscillator the measures the ratio between the directed change in price and the total change in the prices over a given period of time. There are some settings to define: Period – defines the period deployed in the calculation: Overbought – defines the overbought level; Oversold – defines […]
Glitch Index Indicator
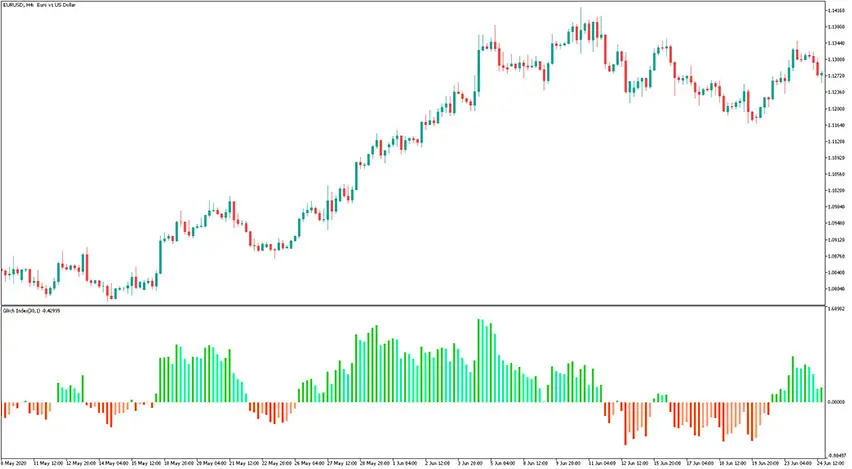
The Glitch Index indicator is a custom forex histogram indicator that shows the index of the price deviation from its average value. That gauge was first introduced in the February edition of Active Trader Magazine in the year 2004. Since then, it has continued to gain popularity and support within the MT5 traders community. These […]
RSI Divergence Candles Indicator
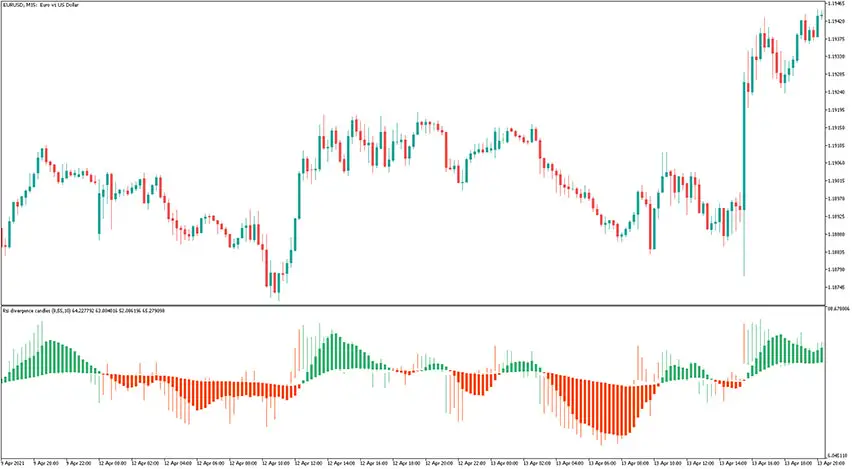
The RSI Divergence Candles Indicator for MT5 is a momentum oscillator that measures the speed and change of price movements. The signals are shown in the form of candles that are colored differently in a manner that gives traders plenty of information about market trends and their directions. The foundation for that indicator is the […]
MACD Color Candles Indicator MT5

The MACD Color Candles Indicator for MT5 is responsible for displaying colorful candlesticks that reflect bullish and bearish momentum based on readings from the famous Moving Average Convergence Divergence indicator. Thanks to received signals, traders get overview of the market momentum. There are often multiple consecutive candlesticks in the same direction, which can help capture […]