Category: Forex MT5 Indicators
Candle Ratio Indicator
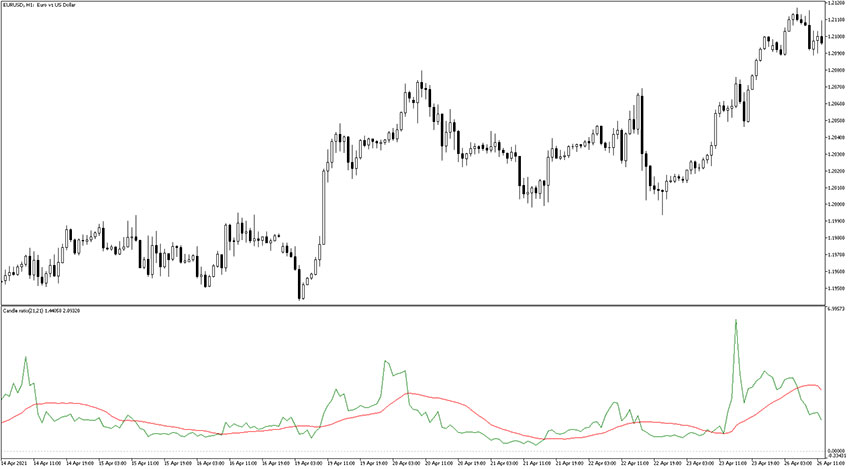
The Candle Ratio indicator measures the ratio that exists between the bullish and bearish candlesticks over the defined period of time. It consists of two lines which are colorized red (smoother line) and green (sensitive line). The default indicator settings can be modified directly from the input tab. Feel free to experiment with the settings […]
Point of Balance (POB) Indicator
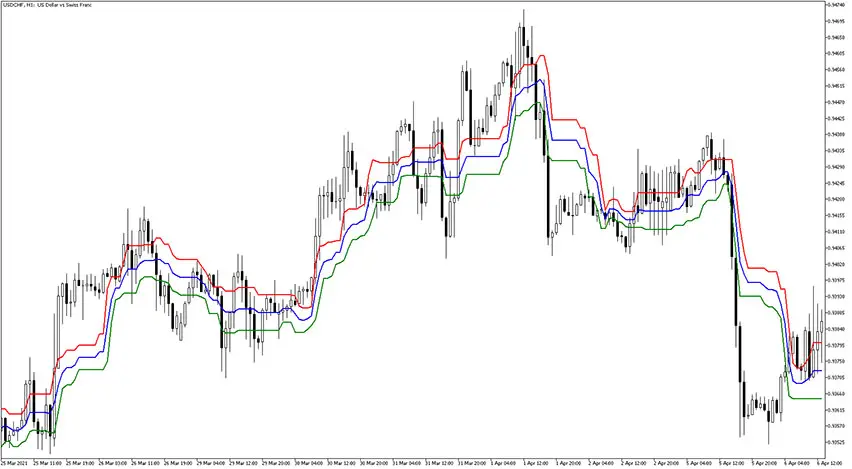
The Point of Balance (POB) indicator lays a triple line channel that serves as the current trend revealer. The price and candlestick move above/below that channel. It consists of three lines: the red and green lines are aligned to the upper outer and lower outer boundaries of the channel respectively, while the blue line stays […]
Synthetic VIX Indicator MT5

The Synthetic VIX Indicator for MT5 is responsible for evaluating market volatility and it tells traders if its increasing or decreasing over time. This is an oscillator so it displays its signals in a fluctuating waveform. The data it provides is especially useful in low-liquidity and sideways markets, where most tools often struggle with noise […]
Coppock Indicator
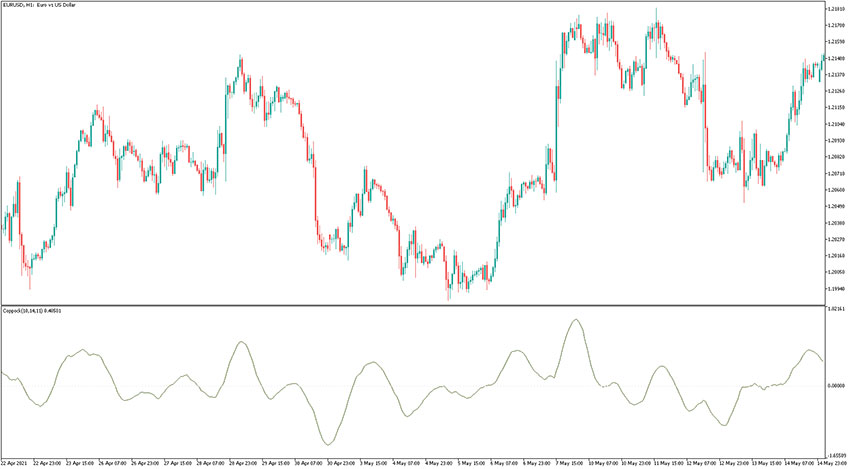
The Coppock indicator is a custom forex indicator that works like an oscillator recognizing market trends. That indicator was first introduced by Edwin Sedgwick Coppock in 1962. He published the formula for calculating the Coppock indicator in the Barron’s Magazine. The formula used in calculating the Coppock does not take into consideration a bearish market […]
Mass Index Indicator
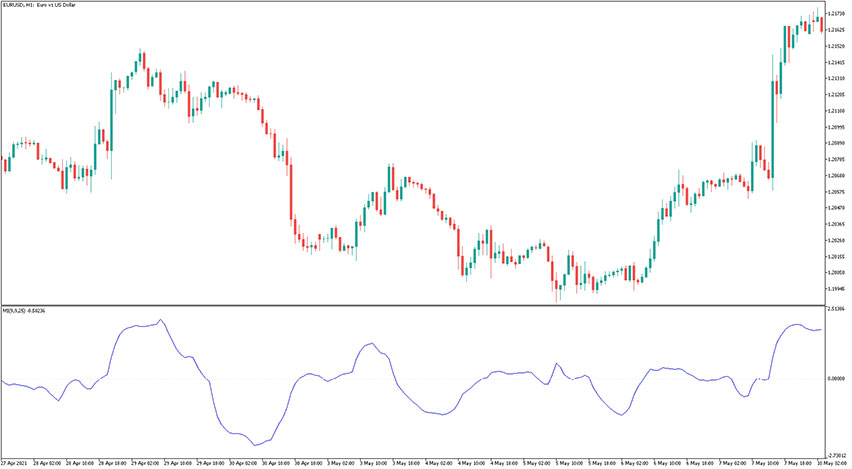
The Mass Index (MI) indicator is used as an accurate trading tool to pinpoint trend reversals as they occur on the chart. That forex indicator is built around the changes between the highest and the lowest prices. These are the adjustable settings: First smoothing period – defines the opening smoothing period; Second smoothing period – […]
RSI Slope Divergence Indicator MTF
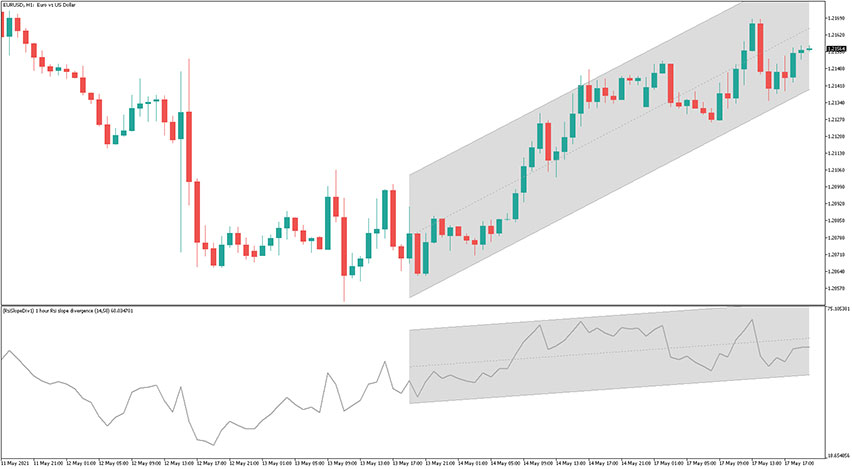
The RSI Slope Divergence indicator MTF plots two linear regression channels: directly on the price and on the Relative Strength Index (RSI). It is a multi-timeframe indicator. The general usage of that gauge is divergences detection, but also correction or retracement even before it occurs.
Price Cycle Indicator
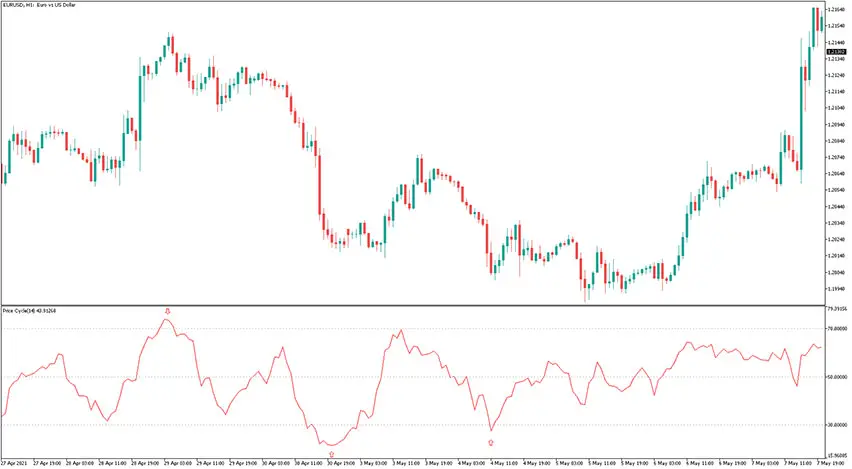
The Price Cycle (PC) indicator is a custom forex oscillator that is used by traders to reveal market cycles in the short and long term periods. A market cycle is defined by series of repeated patterns and that gauge does pretty well in spotting such patterns. You can customize these inputs below: Period – defines […]
Glitch Index Indicator
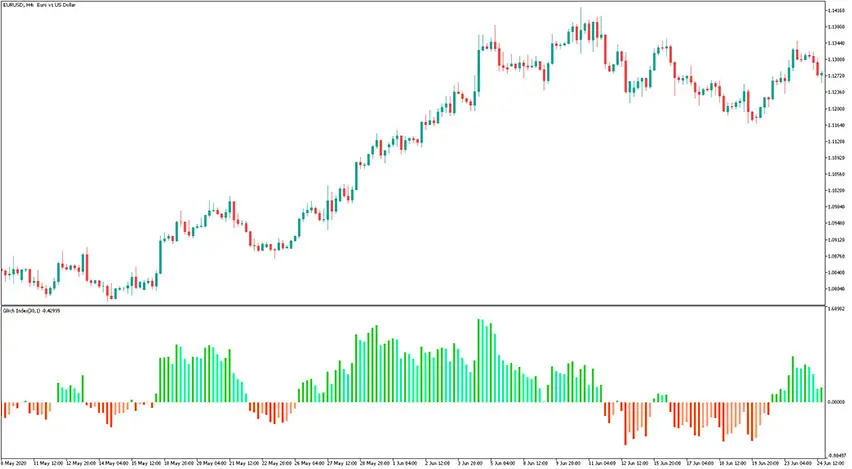
The Glitch Index indicator is a custom forex histogram indicator that shows the index of the price deviation from its average value. That gauge was first introduced in the February edition of Active Trader Magazine in the year 2004. Since then, it has continued to gain popularity and support within the MT5 traders community. These […]
ADMIR Indicator MT5
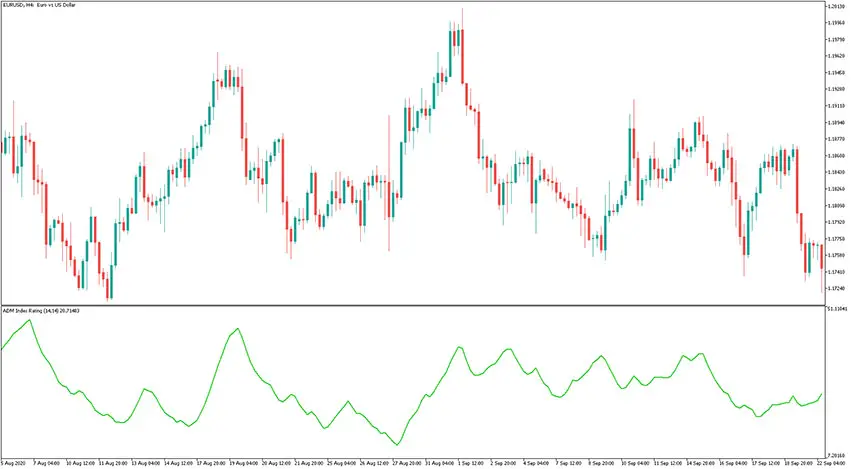
The ADMIR Indicator for MT5 is a forex oscillator whose name stands for Average Directional Movement Index Rating. It calculates the ratio between the ADX values of two Average Directional Movement Index indicators with different time periods. Example chart: How to use the ADMIR indicator for MetaTrader 5? The price is considered to be bullish […]
Percent Difference Oscillator Indicator

The Percent Difference Oscillator (PDO) indicator is, as the name suggests, an oscillator that shows the difference between the moving average and the current close price. Results are provided as the percent of the moving average (above or below the MA). The formula for the Percent Difference Oscillator indicator is the following: PDO = 100*(Close […]