Consolidation Indicator
Platform: MT4 Type: Market Levels Last update: November 30, 2024The Consolidation Indicator for MT4 is based on the scenario where price is simply moving sideways within a limited range. Forex traders who successfully recognize such zone can utilize it by finding local tops and bottoms as well as identyfing breakouts that sooner or later occur.
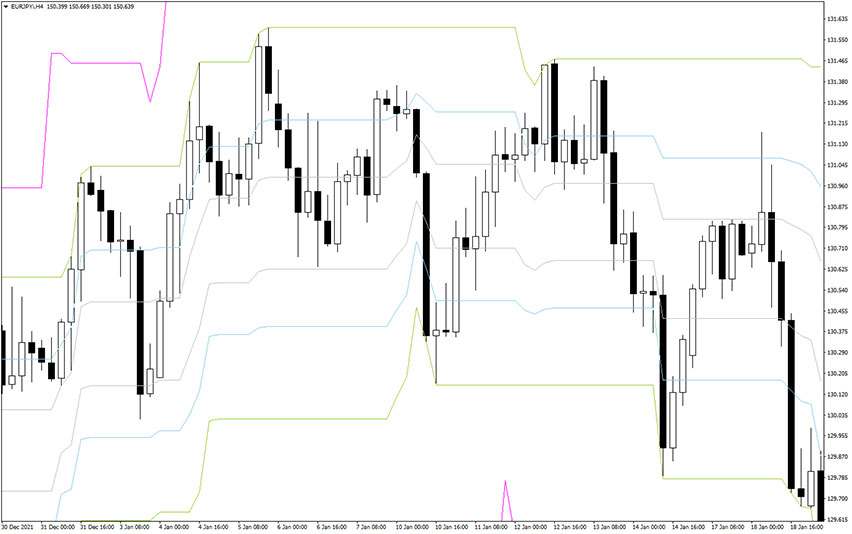
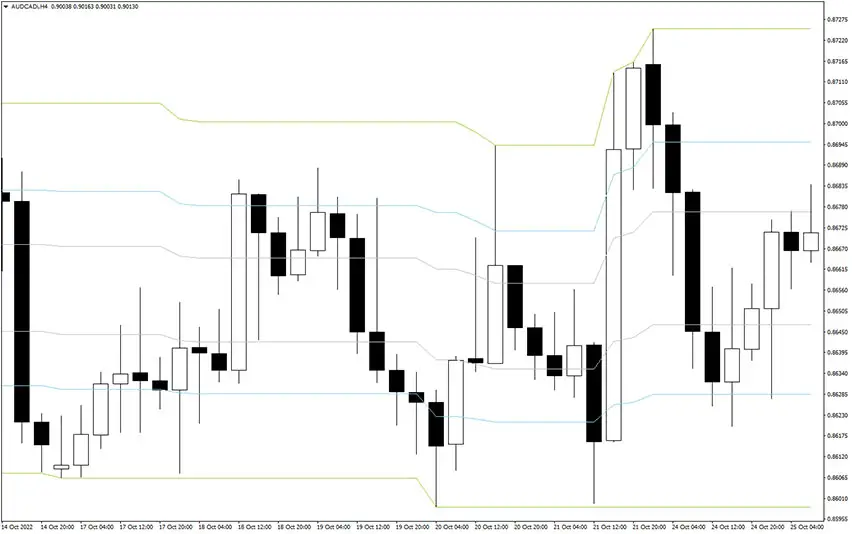
Example chart:
How to use the consolidation indicator for mt4?
Once you understand that price is ranging really really often, you will realize how powerful this strategy is. But first, let’s learn the anatomy of this gauge – it has four channels that vary in distance and color. These are their characteristics:
- the tightest one is gray
- next medium ones are respectively blue and green
- the widest channe is pink
You can think about these lines in terms of support and resistance levels. The starting point is analysis of the volatility of the bands. When you see it more less flat, it means high-probability rangeboud period. In such case, the best entry points appear at the touch and rejection of the green lines, but observe the price action.
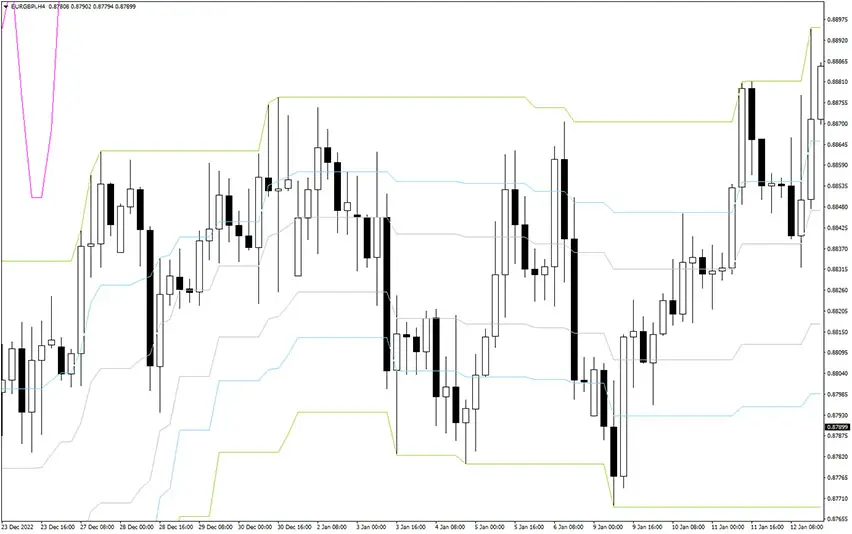
How to recognize breakout?
Typically for this indicator, watch the lean of bands. You should be alarmed when the get steepy in short amount of time. First the candlesticks would firmly break the recent support or resistance and then keep pushing to given direction. This approach requires good concentration and recognizing the setup early. Alternatively, you can just use it as information when to avoid trading and focus only on consolidations.

Submit your review | |