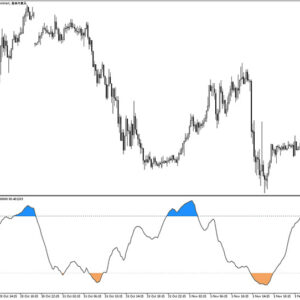
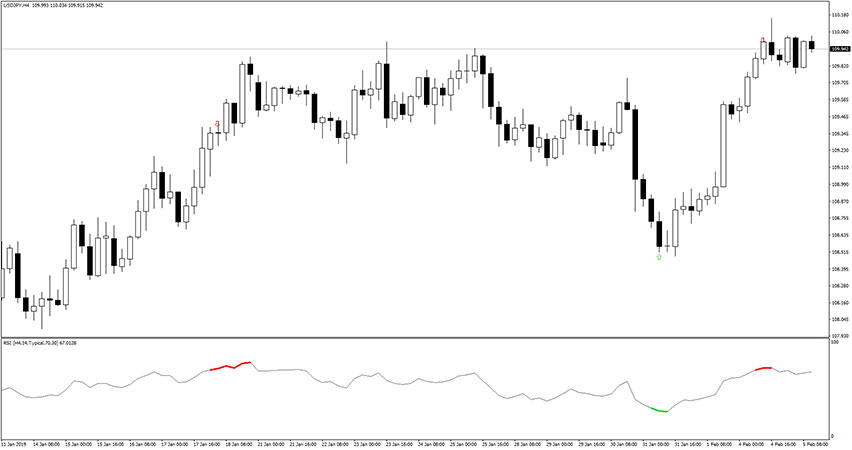
RSI Color Indicator for MT4

Introduction to the RSI Color Indicator

The RSI Color indicator is a custom Relative Strength Index indicator.

It has an additional feature that colorizes the oscillator line when it hits the overbought/oversold area. You will also find buy/sell arrows which are displayed when the oscillator reaches these levels.

It fits all kinds of timeframes and currency pairs.

The indicator is displayed in a separate window placed just below the main trading chart.

The default settings can be modified directly from the input tab. Feel free to experiment with the settings and parameters to fit your personal preferences.

Related:
RSI Divergence Indicator
MBFX Timing Indicator

How to set up the RSI Color indicator in MT4?

Installation Guide

Copy and paste the color-rsi.ex4 or color-rsi.mq4 indicator files into the MQL4 folder of the Metatrader 4 trading platform.

You can gain access to this folder by clicking the top menu options, which goes as follows:

File > Open Data Folder > MQL4 > Indicators (paste here).

Now go to the left side of your MT4 terminal. In the Navigator find the gauge name, right-click it and select Attach to the chart.

Bottom Line

The RSI Color indicator is well worth adding to your trading collection but remember about having realistic expectations. Just like any other technical analysis tool, is not capable of providing accurate signals 100% of the time. Thus, this forex indicator provides false signals occasionally. Its performance will vary significantly depending on market conditions. Feel free to develop your own trading system based around it.

RSI Color Indicator Free Download

To download the RSI Color Indicator for Metatrader 4 (MT4) for free just click the button below:

RSI Color Indicator Free Download


Related products