RSI Divergence Indicator
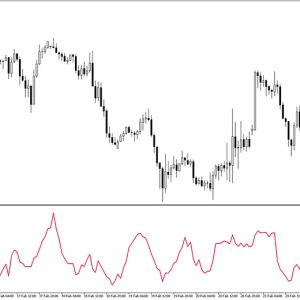
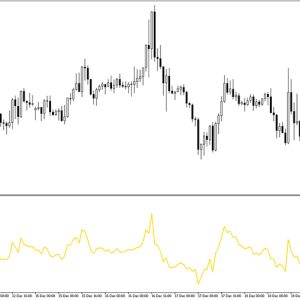
Platform: MT4 Type: Pattern Last update: October 21, 2024The RSI Divergence Indicator for MT4 is responsible for showing a divergence between the price and the Relative Strength Indicator. You can see it as yellow and red lines.
The classical RSI indicator is an oscillator that signals the two extremes of the market: oversold and overbought levels. Using the classic 14-period RSI, the sell signal occurs when the RSI line exceeds 70, while a buy signal occurs when the indicator’s value is below 30.
What actually is divergence?
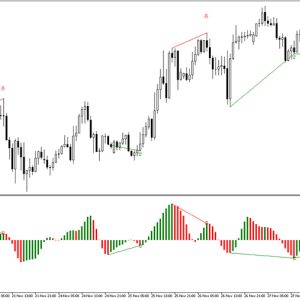
Divergence is a disagreement between the price action and the oscillator. You can notice this pattern when the lower lows (in a downtrend) or higher highs (in an uptrend) of the price chart differs from the peaks and troughs of the oscillating RSI indicator. This approach is used for finding and trading market trend reversals. It’s one of the most powerful price action forex strategies.
In a few simple words, during uptrend divergence between price action and RSI happens when the price of a currency pair makes higher highs but the RSI indicator does not, and alternatively, during downtrend divergence between price and RSI happens when the price of a currency pair makes lower lows but the RSI indicator does not.

How to trade with the RSI Divergence Indicator?
These signals are pretty easy to follow and you can find them below.
Bullish divergence
Open BUY trade when the following conditions are met:
- There is a downtrend.
- The price action of your currency pair makes lower lows.
- The RSI Divergence Indicator draws a divergance line.
- That is an early signal of a trend reversal. You can go long after closed candle.
- Optionally, you can confirm the buy trade with the help of other technical tools.
- Take profit or exit the trade at the arrival of the opposite signal.
Bearish divergence
Open SELL trade when the following conditions are met:
- There is an uptrend.
- The price action of your currency pair makes higher highs.
- The RSI Divergence Indicator draws a divergance line.
- That is an early signal of a trend reversal. You can go short after closed candle.
- Optionally, you can confirm the sell trade with the help of other technical tools.
- Take profit or exit the trade at the arrival of the opposite signal.
Submit your review | |