RSO Indicator MT4
Platform: MT4 Type: Oscillator Last update: July 12, 2026The RSO Indicator for MT4 is oscillator variation of Relative Strength Index.
The difference between them is that RSO presents its signals in the form of an oscillator line plus histogram bars.
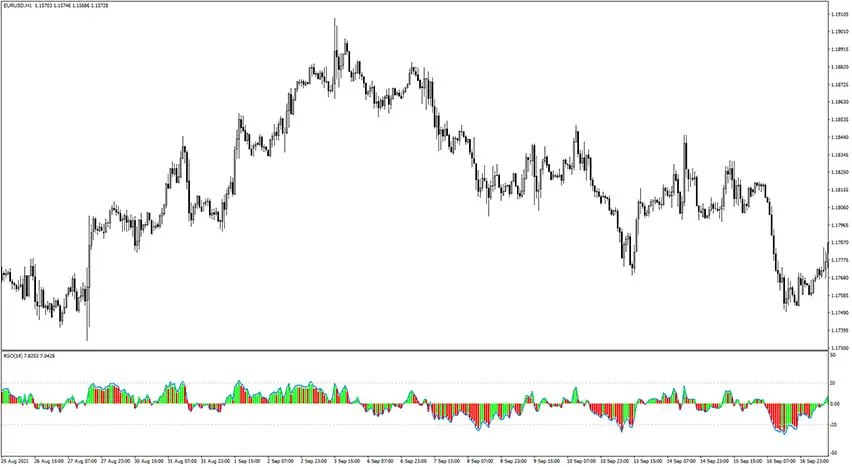
Example chart:

How to use the RSO Indicator for MT4?
Most oscillators swing around a center line, usually at 0.0. The RSO gives you that same reference point.
It’s actually just the RSI shifted down by 50 points. So instead of watching for 70/30 like you would on the RSI, you watch for 20/-20 on the RSO. Same signal, new scale.
The RSO also adds colored bars so you don’t have to squint at the line. Green means the RSO is rising, red means it’s falling.
This makes small shifts easy to spot, even when the curve itself barely moves. For example, if the RSO is above 20 and the bar suddenly turns red, that’s your cue: momentum just flipped, even before the line makes a big move.
Summary
The RSO indicator for MetaTrader 4 is an interesting alternative for the RSI. Basic principles are very similar since the indicator also shows overbought and oversold levels.