Tag: histogram indicators
Momentum Histogram Indicator MT4
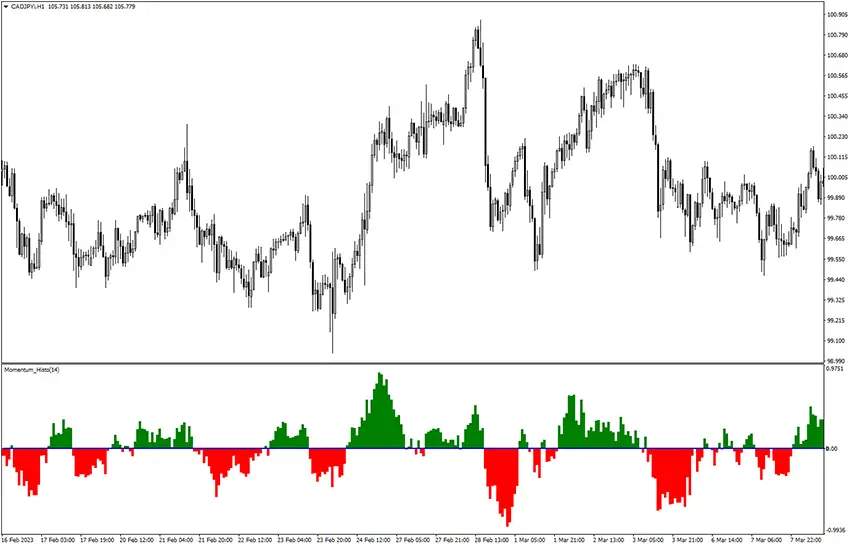
The Momentum Histogram Indicator MT4 (MetaTrader 4) offers forex traders a visual representation of the momentum of a particular currency pair. It displays histogram bars, which helps determine the strength and potential direction of a market trend. By utilizing momentum as its foundation, this forex indicator functions as a widely favored tool for technical analysis […]
QQE Histogram Indicator
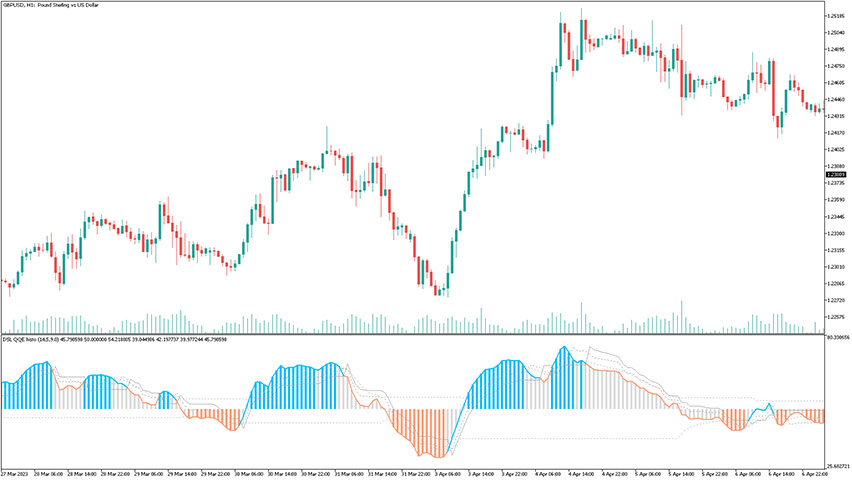
The QQE Histogram Indicator for MT5 is an enhanced version of the QQE technical indicator, but it has several interesting features added. This tool introduces discontinued signal line levels to provide more insights into the trend. What’s more, it also includes color-changing histogram bars that correspond to these mentioned levels. As always, free download is […]
MACD Histogram Multi-Color Indicator MT5
Introduction to the MACD Histogram Multi-Color Indicator The MACD Histogram Multi-Color Indicator shows the difference between the MACD and Signal Lines. For the calculation of the MACD line, you can choose from the usual price types. For the calculation of the Signal Line, you can choose between SMA or EMA. The histogram can be switched […]
MACD Colored Histogram Indicator MT4
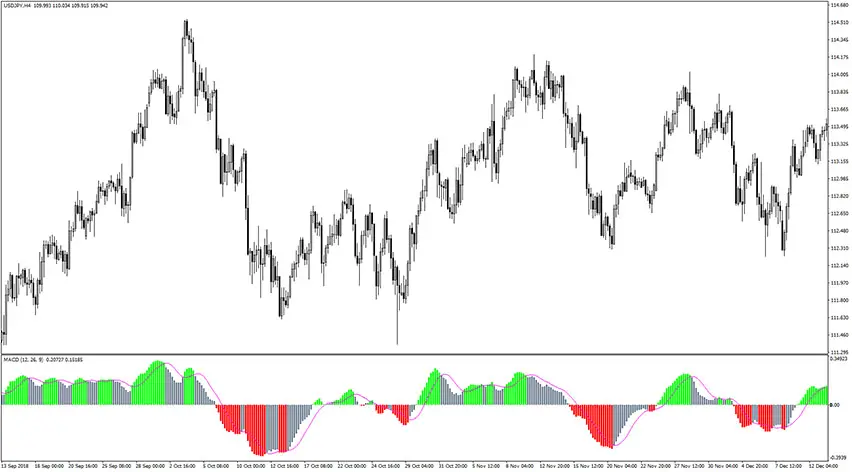
Introduction to the MACD Colored Histogram Indicator The MACD Colored Histogram Indicator is a high-demand trading gauge as the Moving Average Convergence and Divergence indicator is one of the most popular forex indicators out there. The MACD Color Histogram is a variation of the classic MACD and will be further described in the next parts […]
MACD Histogram with Filter MA Indicator MT4
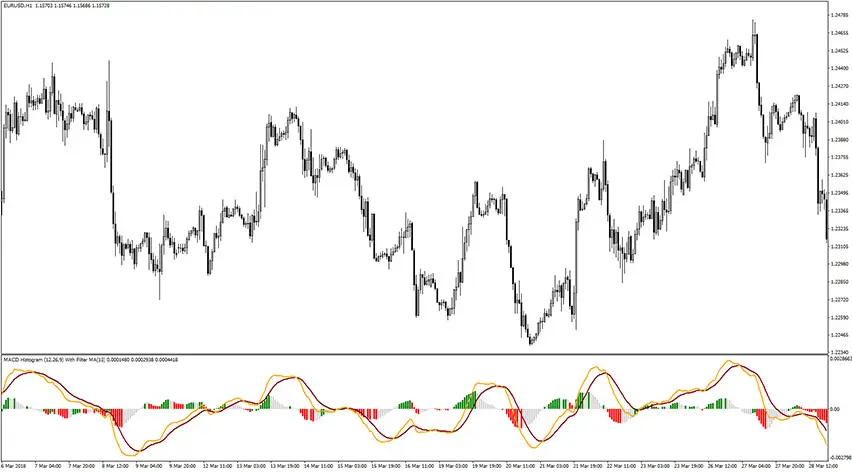
Introduction to the MACD Histogram with Filter MA Indicator The MACD Histogram with Filter MA Indicator is, as the name suggests, a combination of the popular momentum indicator MACD Histogram with the trend determinator Moving Average. As a result, one gets a gauge that provides the correct areas to make the market entry and trade […]
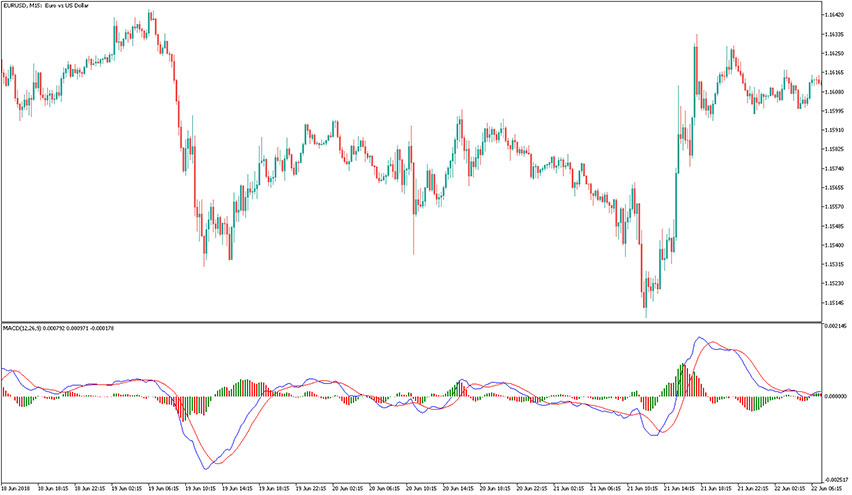
MACD Histogram Indicator
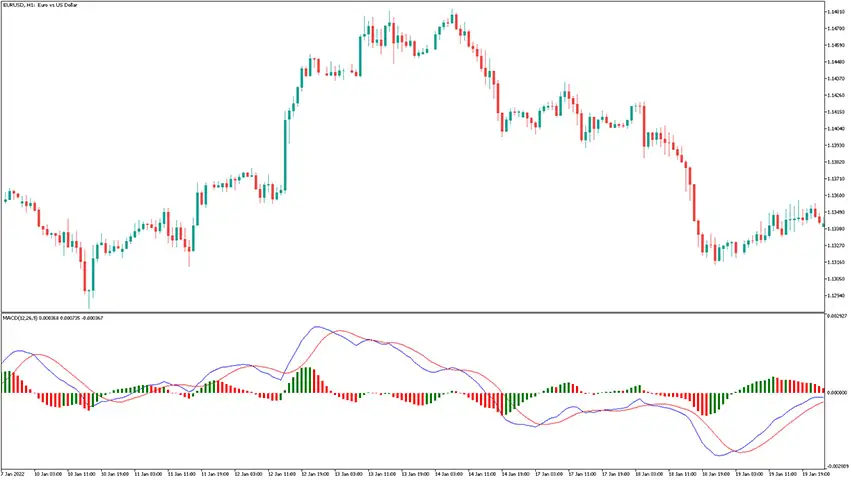
The MACD Histogram Indicator for MT5 is a variation of a popular MACD indicator, but as the name suggests, it has added histograms to display the difference between the MACD and the signal lines. For the calculation of the MACD line, one can choose from the usual price types. For the calculation of the signal […]
MA Crossover Histogram Indicator
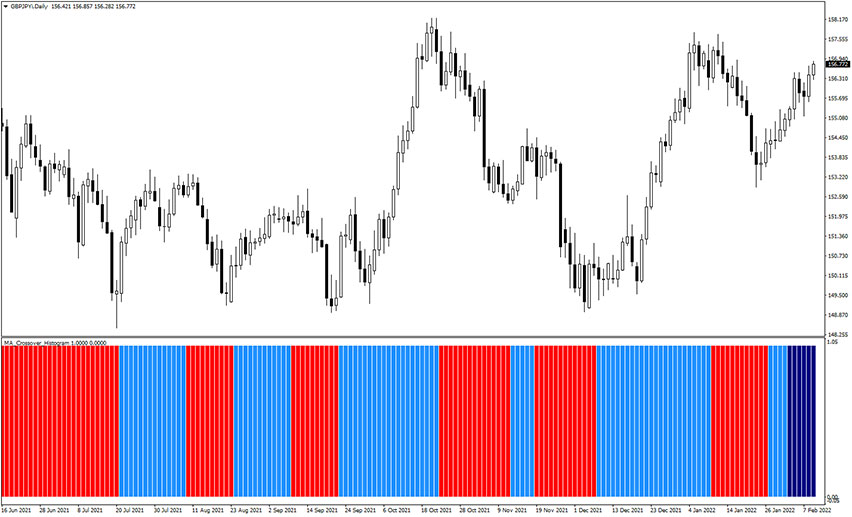
Introduction to the MA Crossover Histogram Indicator The MA Crossover Histogram Indicator is, as the name suggests, an histogram indicator based on Moving Average crossover. Signals provided by that gauge are simple. Blue histogram bars refelct bullish crossover, while red histogram bars indicate bearish crossover. We suggest using it as trend direction filter. The MA […]
Advanced ADX Forex Indicator MT4 Free Download
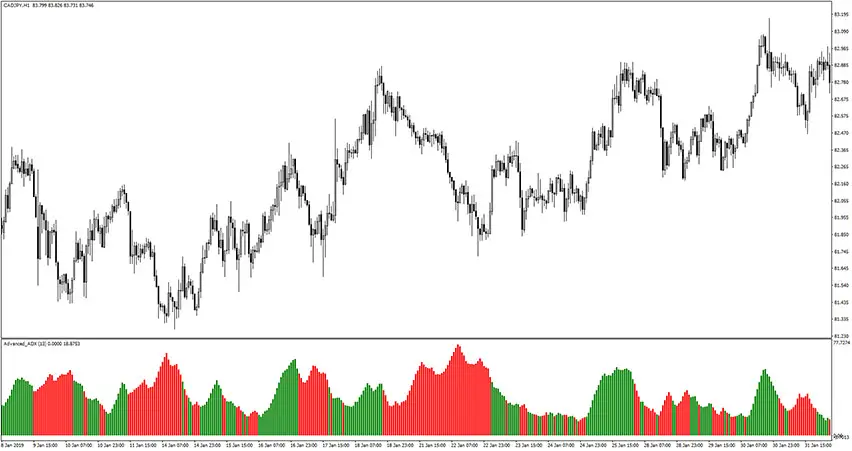
Introduction to the Advanced ADX Forex Indicator The Advanced ADX Forex Indicator draws colored signal histogram bars that measure the strength of the trend. The ADX abbreviation stands for the Average Directional Index. Green ADX histogram bars suggest the trend is considered bullish, while red ADX bars suggest the trend is considered bearish. It’s better […]
WPR Histogram Vol Indicator
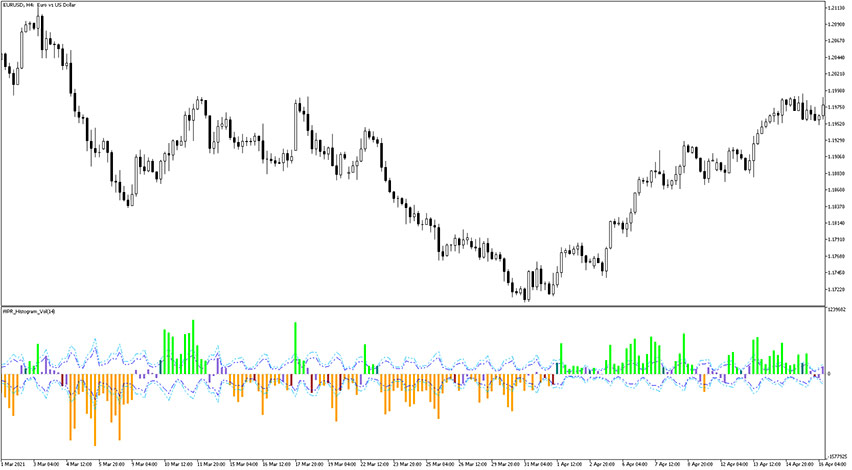
Introduction to the WPR Histogram VolIndicator The WPR Histogram Vol Indicator is, as the name suggests, a forex volume indicator based on Williams Percentage Rate. It is developed on the following formula: WPR Histogram Vol = ( WPR + 50) * Volume. For quite understandable reasons, the recalculation of overbought and oversold levels in such […]
Moving Averages RSI Histogram Indicator
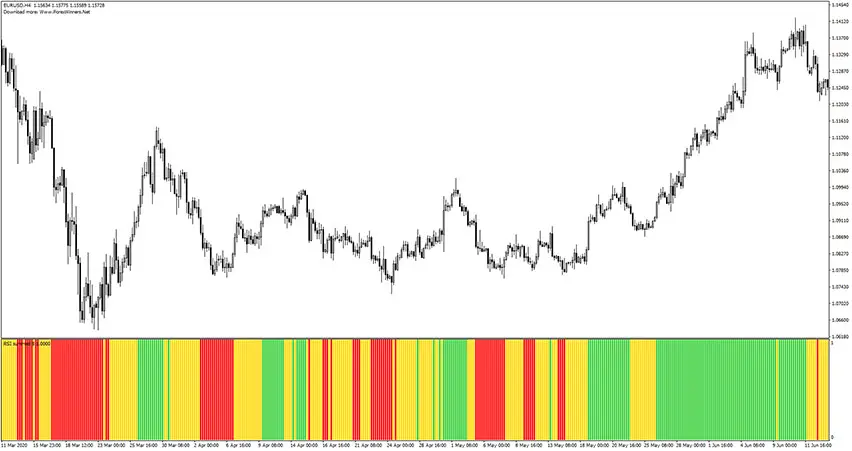
Introduction to the Moving Averages RSI Histogram Indicator The Moving Averages RSI Histogram Indicator is, as the name suggests, a combination of two forex gauges: Moving Average and Relative Strenght Index (RSI), and its signals are provided in the form of a histogram. When both indicators agree for bullish signal, histogram bars are green. Similarly, […]