Category: Forex MT5 Indicators
Support and Resistance Indicator
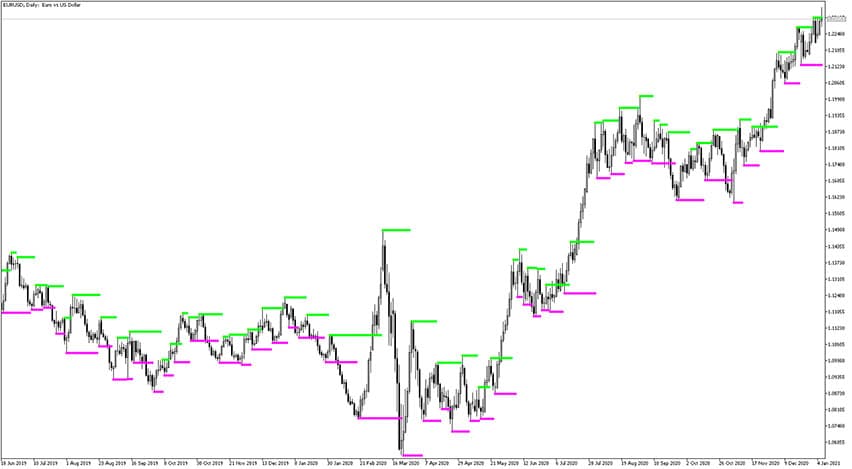
The Support and Resistance indicator for MT5 displays the support and resistance levels using the Fractals indicator. The calculation of support levels is based on the “Fractals down”, and the calculation of the resistance levels is based on the “Fractals up” of the Fractals indicator by Bill Williams. These levels are shown in the form […]
Heiken Ashi Smoothed Indicator MT5
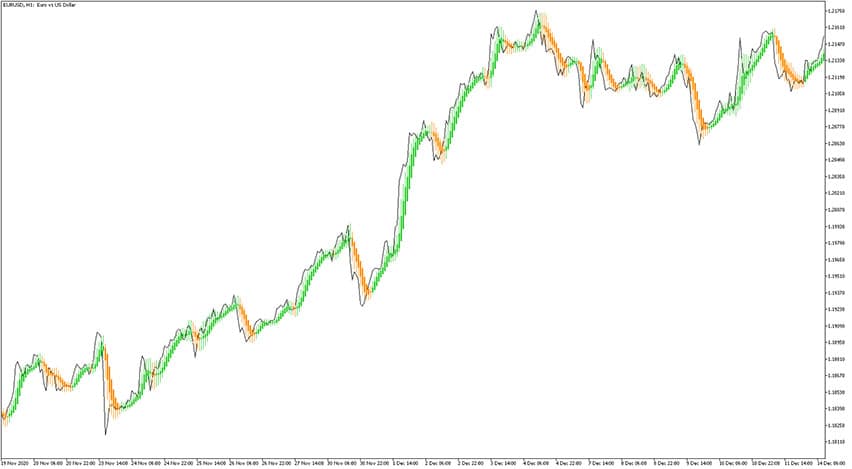
The Heiken Ashi Smoothed Indicator for MT5 help to recognize trend in a clean manner. In comparison to the regular heiken ashi candles, this variation incorporates several improvements, resulting in solid and accurate signals in the output. It works even better regarding noise reduction, thus forex traders get clearer overview on the market situation. Example […]
PPMCC Indicator

The PPMCC shortcut means Pearson Product-Moment Correlation Coefficient (Pearson’s PCC). That tool displays the linear relation between the moving average values of two forex pairs with values ranging from -1 to +1. When the chart is above zero, a positive correlation is marked. Correlation is negative below zero. Zero indicates that there is no correlation. […]
Heiken Ashi Indicator
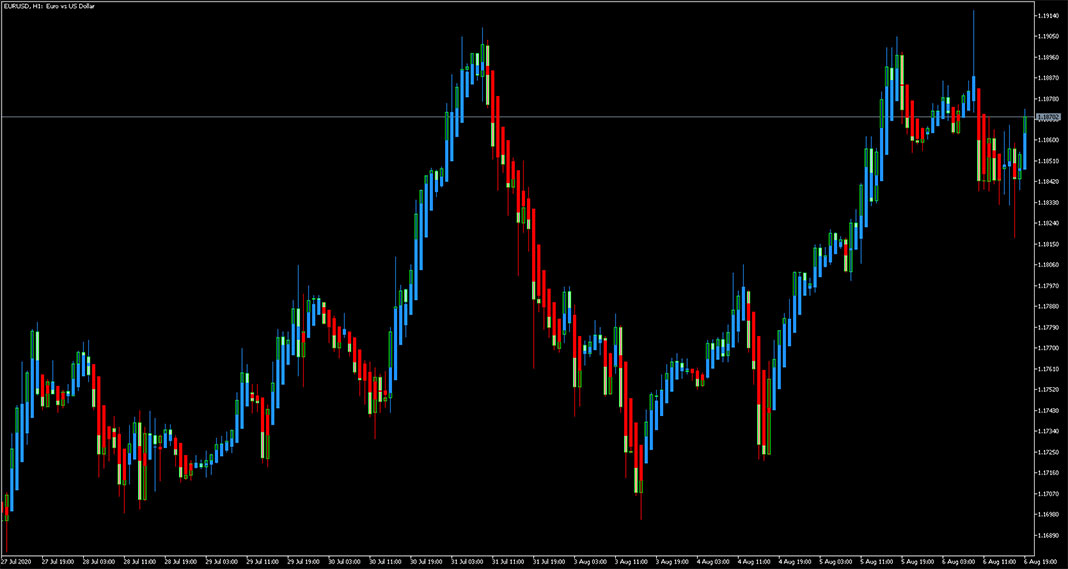
The Heiken Ashi Indicator for MT5 is an alternative approach to displaying price candlesticks. While the most traders are familiar with so-called japanese candlesticks, the heiken ashi utilizes different formula with the goal to reflect trends better. These bars usually have longer wicks and are filled with blue and red colors – they respectively corresponds […]
RSI Candles Smoothed Indicator MT5
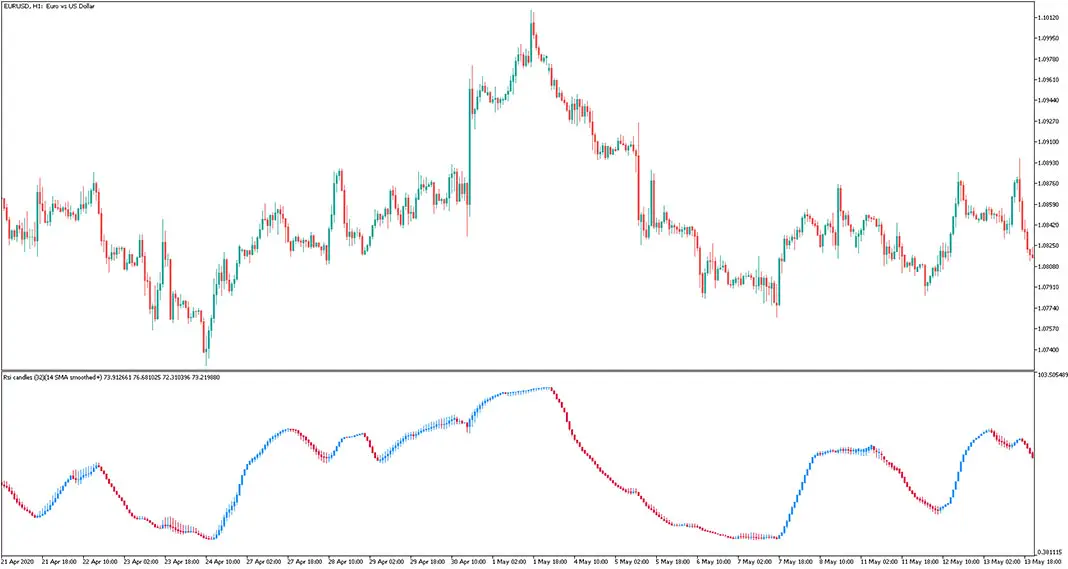
The RSI Candles Smoothed Indicator for MT5 is a combination of four RSI values (RSI of High, Low, Open and Close) displayed as candles in a sub-window below the main trading chart. This version has an additional options to enable prices pre-smoothing prior to be used in a calculation, which makes it an RSI-of-MA combination. […]
Ehlers IFT of Smoothed RSI Indicator MT5

The Ehlers IFT of Smoothed RSI Indicator for MT5 displays an dynamic channel with highlighted areas of overbought and oversold readings. As the name suggests, this is a sophisticated combination of Inverse Fisher Transformation and Relative Strenght Index. By default, its automatically adjusting to fluctuactions, but if you prefer fixed scale, change the floating levels […]
RSI with RSI Indicator MT5
The RSI with RSI Indicator for MT5 presents interesting approach, combining two instances of the classic relative strength index oscillator. Most of the regular rsi-based indicators uses just one source for the calculations, this tool takes a step further and leverages dual readings. By doing so, the indicator captures both short-term retracements and long-term trends. […]
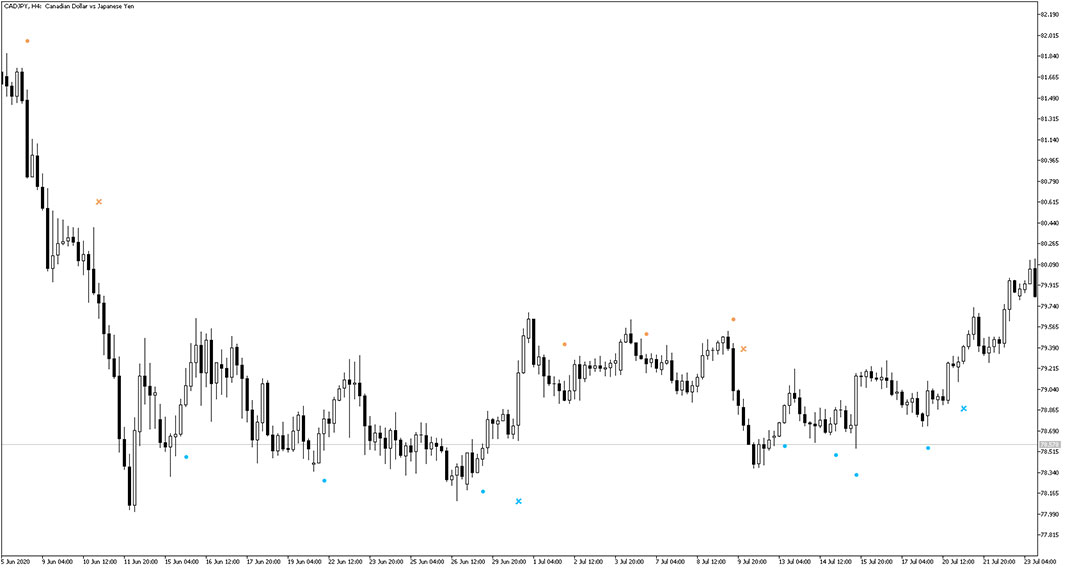
RSI HTF Indicator MT5
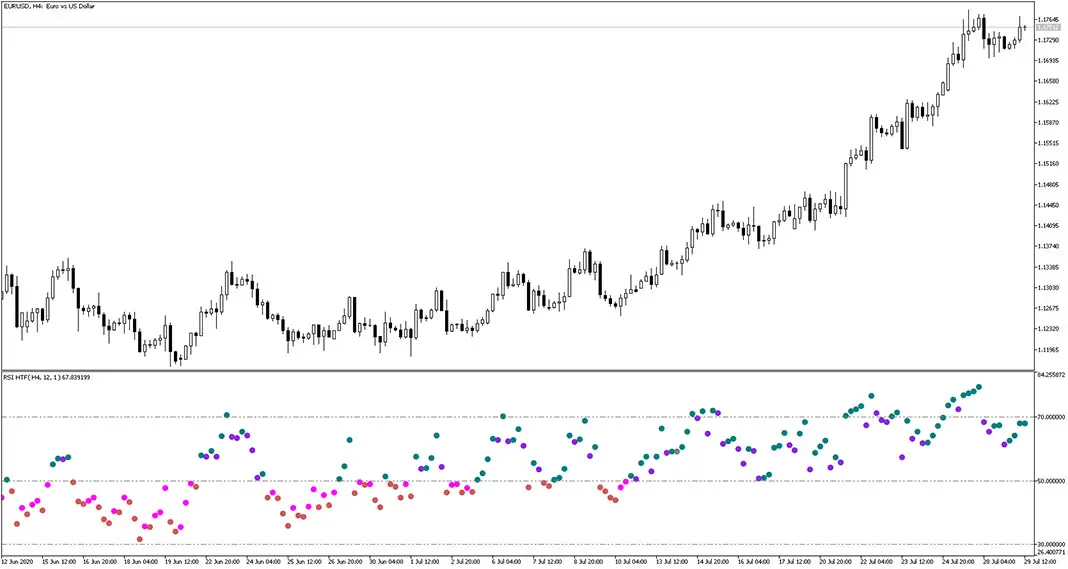
The RSI HTF Indicator for MT5 is an interesting variation of the famous Relative Strength Index. This version provides signals in the form of colorful dots instead of the traditional oscillator line. The dots appear red in the lower section and green in the upper section, with the separation line at the 50 value level. […]
CCI of EMA Indicator MT5
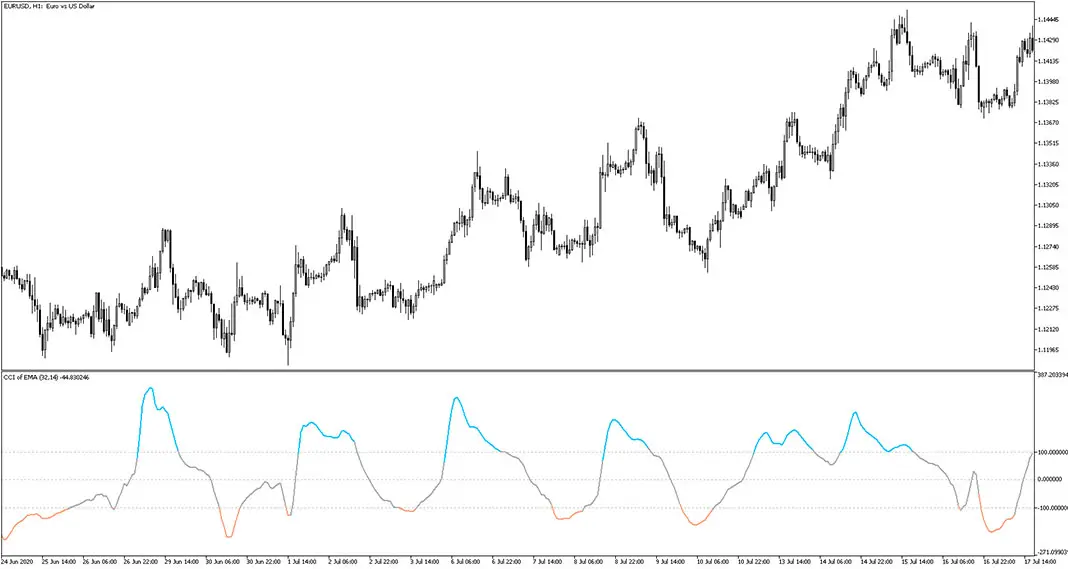
The CCI of EMA Indicator for MT5 displays an oscillator line which takes additional colors after reaching overbought or oversold zones. Essentially, this is a hybrid technical analysis tool that blends the Commodity Channel Index with an Exponential Moving Average. Example chart: How does the cci of ema indicator for mt5 work? Normally, the CCI […]
Double Smoothed Stochastic Indicator MT5
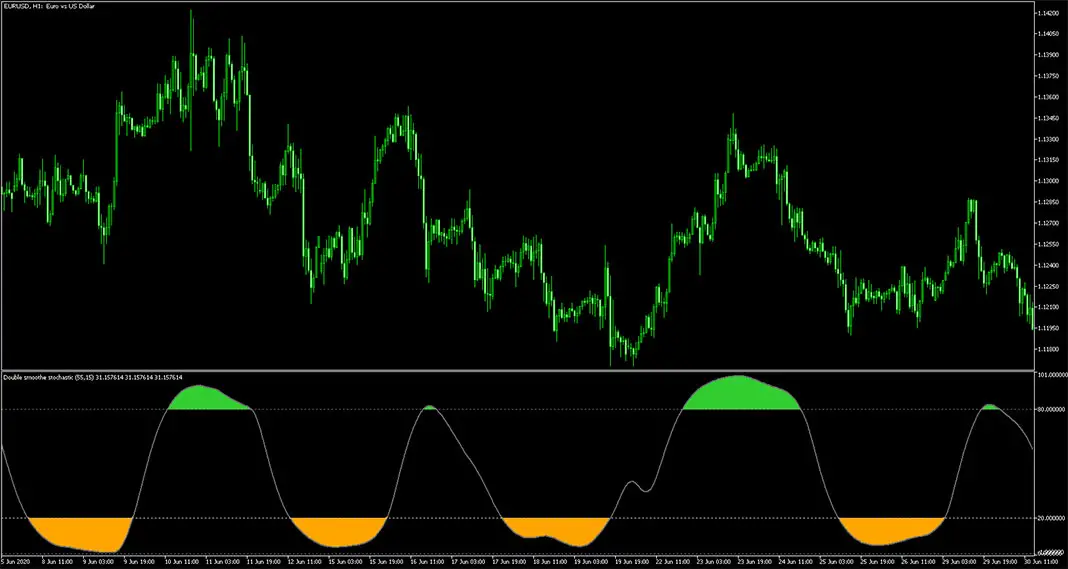
The Double Smoothed Stochastic Indicator for MT5 displays long-term stochastic line with highlighted extreme areas using colorful fillings. This allows traders to see the market with less noise and let them prepare for potential reversal trades. Example chart: How to use the double smoothed stochastic indicator for mt5? Once the indicator is activated, it shows […]