RSI Indicator: Beginners Guide
Platform: MT4 Type: Oscillator Last update: August 2, 2024What is the RSI indicator?
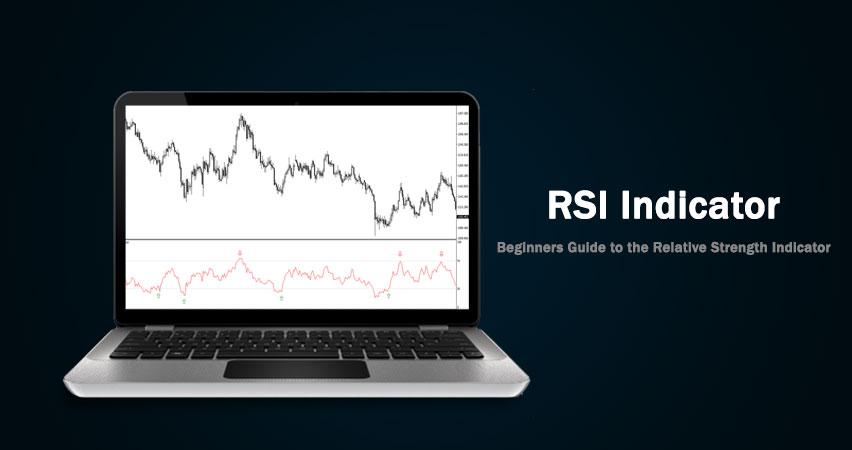
The abbreviation RSI stands for a Relative Strength Index and it a well-known oscillator used in technical analysis. It is applicable in multiple markets, including forex, stocks, and cryptocurrencies. The RSI indicator shows the price momentum by comparing bullish and bearish movements of closing prices of a specific asset.
The RSI is an oscillator so it makes moves typical for oscillators – it oscillates between the “0” and “100” levels. For trading purposes you will commonly see three levels highlighted, which are the following:
Level 70: indicates that the market is in an overbought condition;
Level 50: is the “trigger” or signal entry point;
Level 30: indicates that the market is in an oversold condition.
The RSI indicator has the following functions:
- it shows price divergences;
- it allows predicting possible trend line breakouts in the price;
- it helps validate the chartist analysis;
- it allows confirming market entries (trading signals);
- it helps to recognize the overbought and oversold conditions in the price;
- it works in any timeframe;
- it works practically on any financial instrument or any forex currency pair.
RSI-Price Divergences
The RSI indicator, in addition to showing oversold or overbought levels, as well as buying and selling signals, may also show divergences between indicator and price. Two main divergence types are bullish (buy signal) and bearish (sell signal).
This type of signal has high reliability but must be supported by other technical analysis tools to decide on the entry point.
The RSI-price divergence represents a potential entry signal into the market in the opposite direction of the current dominant trend (counter-trend), so it is bearish in an uptrend or bullish in a downtrend.
RSI Bullish Divergence:
Here is an example chart showing the RSI Bullish Divergence:

A bullish divergence occurs when the price keeps making lower lows, while the equivalent lows of the RSI indicator are increasing. In other words, the price falls as the RSI rises.
RSI Bearish Divergence:
Here is an example chart showing the RSI Bearish Divergence:

A bearish divergence occurs when the price keeps making higher high and the equivalent highs of the RSI indicator are decreasing. In other words, the price rises as the RSI falls.
Must-see: RSI Divergence Indicator MT4
The RSI Indicator and Trendline Breakouts
The RSI indicator is capable of showing the trendline breakouts. To utilize that strategy, simply add a trendline to the maximum or minimum points in the price corresponding to the support points for a trendline and when there is a breakout in the RSI, then this breakout may be followed by a breakout in the trend line
This signal is reliable but must be used in conjunction with more technical analysis confirmators.
Here is an example chart showing the RSI Trendline Breakout:

Candlestick and Chart Patterns Confirmation with RSI
The RSI among its other functions allows us to confirm some chart patterns and this greatly increases the reliability of chartist analysis.
In the example below, you can see a classic trend continuation pattern named “flag” which usually appears in upward or downward trends.

During a strong uptrend, a “flag” pattern took place, which was confirmed both with candlestick patterns and RSI indicator.
When you find other chart patterns in the price as triangles you can use the RSI to identically identify such formation and confirm it.
Summary
There are multiple techniques of using the Relative Strength Indicator. Each one of them, when executed properly, increases your chances of success in trading. To gain confidence in trading with the RSI indcator, manually practice recognizning RSI Divergences, Trendline Breakouts, and Chart and Candlestick Patterns.