Tag: histogram indicators
QQE Histogram Indicator
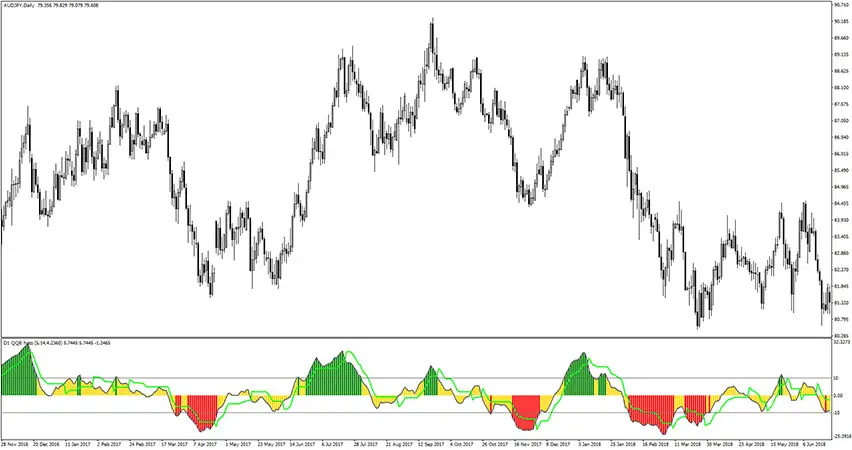
The QQE Histogram Indicator is another variation of the original QQE indicator, which was only used to show the QQE values. This gauge, as the name suggests, shows signals in the form of a histogram, demonstrating a clear momentum overview and overbought/oversold levels. Trading rules with the qqe histogram The QQE Histogram Indicator is very […]
Automatic Trendlines Histogram Indicator
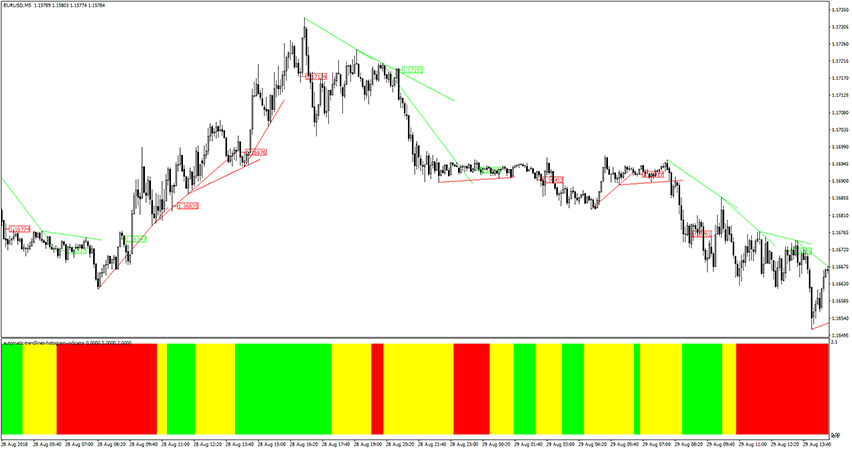
The Automatic Trendlines Histogram Indicator for MT4 works in two fields simultaneously. It draws automatic trendlines and displays trend histogram bars at the same time. The auto trendline is your dynamic support and resistance levels, while trend oscillator (histogram) comes in handy as a trend direction filter. How to use the automatic trendlines histogram? The […]
WPR Smooth Histogram MTF Indicator

The WPR Smooth Histogram MTF Indicator for MT4 is a forex trading indicator based on the Williams’ Percent Range determining forces of bulls and bears in the market. As the name suggests, this is a histogram so the trading signals are represented in the form of histogram bars. Moreover, this is smoothed forex indicator making […]
Jurik Smooth Histogram MTF Indicator
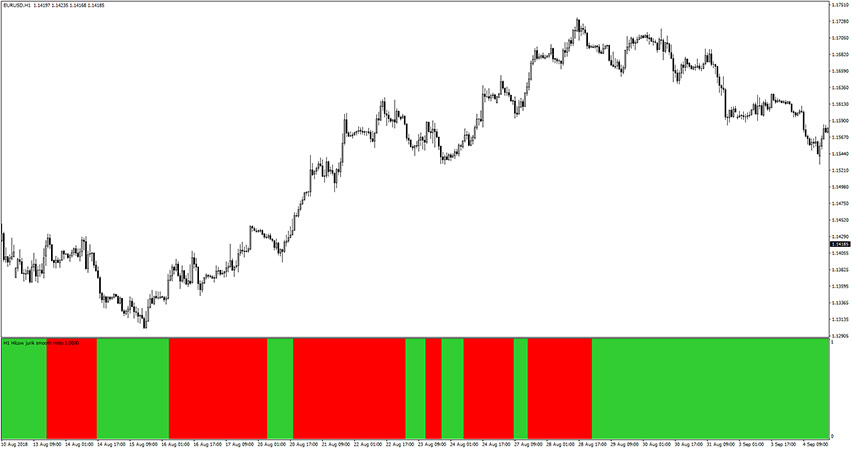
The Jurik Smooth Histogram MTF Indicator for MT4 is a simple forex trend oscillator that helps to understand the current market momentum and notifies you of possible changes in the market trends. It uses histogram bars to display its trade signals. The developer of the Jurik Smooth Histogram placed emphasis on both the simplicity and […]
Forex Tyrannosaurus Indicator
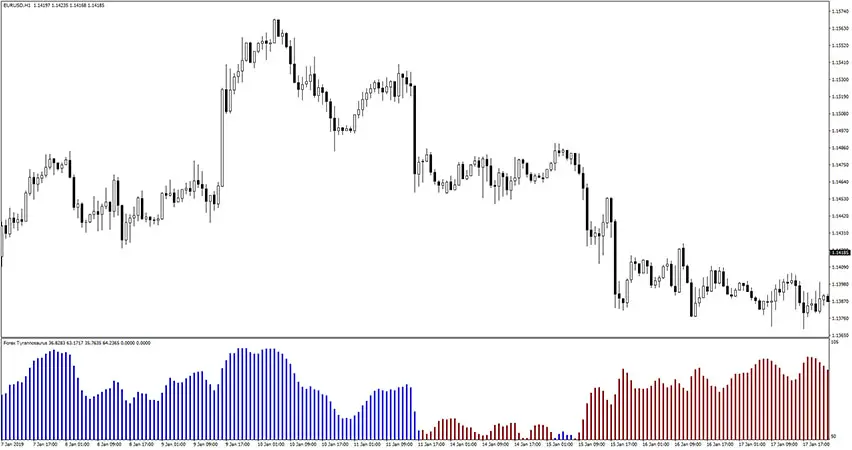
The Forex Tyrannosaurus Indicator for MT4 uses a custom formula to calculate trend momentum and depicts these values in the form of histogram bars colored into blue and red. It’s pretty straightforward to use the Forex Tyrannosaurus indicator, simply blue bars reflect a bullish trend, and red bars reflect a bearish trend. We think that […]
Candle Average V3 Indicator

The Candle Average V3 Indicator for MT4 uses a custom formula to calculate trend-following values and displays them as rising and falling histogram bars. It’s based on a moving average length and high, low and close prices for given period. Example chart: How to understand the signals provided by the candle v3 average indicator? All […]
Glitch Index Indicator
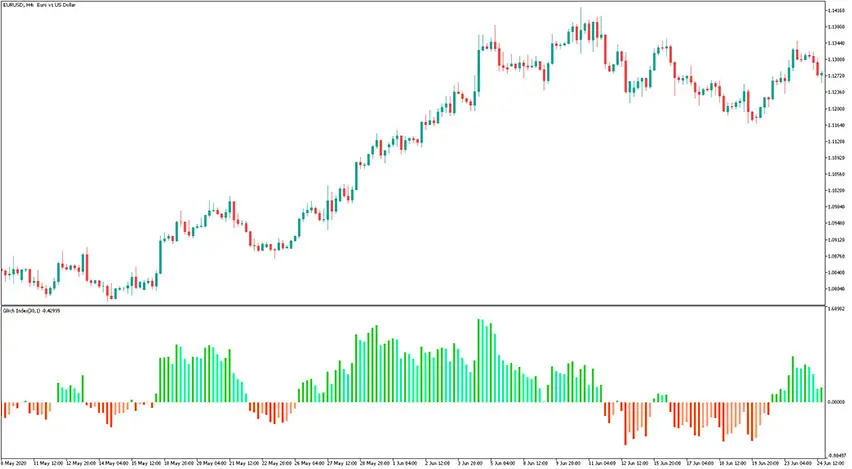
The Glitch Index indicator is a custom forex histogram indicator that shows the index of the price deviation from its average value. That gauge was first introduced in the February edition of Active Trader Magazine in the year 2004. Since then, it has continued to gain popularity and support within the MT5 traders community. These […]
RSI Divergence Candles Indicator
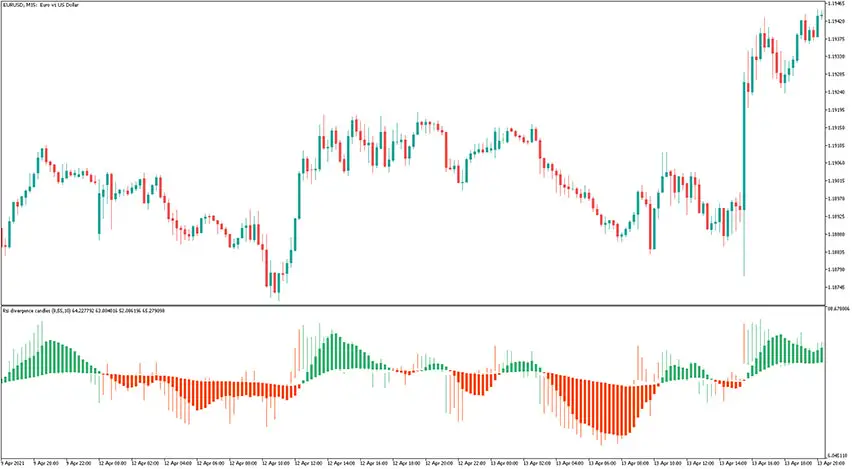
The RSI Divergence Candles Indicator for MT5 is a momentum oscillator that measures the speed and change of price movements. The signals are shown in the form of candles that are colored differently in a manner that gives traders plenty of information about market trends and their directions. The foundation for that indicator is the […]
Three Moving Averages Convergence/Divergence (MAxCD) Indicator
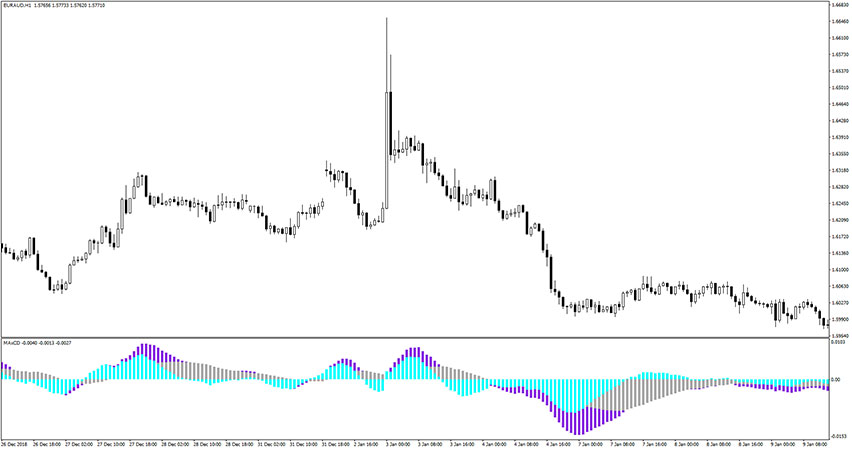
The Three Moving Averages Convergence/Divergence (MAxCD) indicator also known as MAxCD, is a signal oscillator that consists of three moving averages. This forex indicator draws three colored histogram bars that float above and below the zero level. Each color of the histogram bar represents each moving average. The readings of that gauge are really easy […]
Laguerre Histogram Indicator
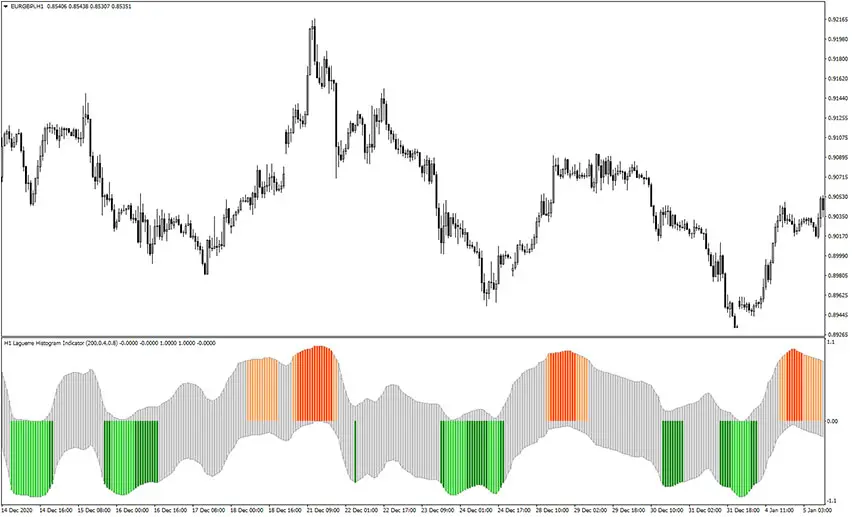
The Laguerre Histogram indicator, as the name suggests, displays Laguerre Oscillator signals in a form of the histogram bars, but also in an unusual way. These histogram bars are plotted into some kind of channel. Generally speaking, green bars represent an oversold market state and opportunity for a long trade (buy). Similarly, red bars represent […]