
Tag: histogram indicators
Laguerre Histogram Indicator
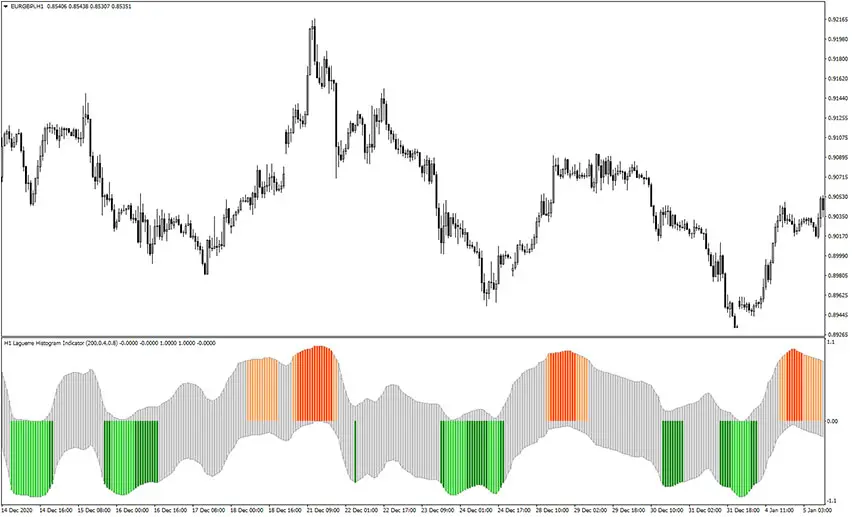
The Laguerre Histogram indicator, as the name suggests, displays Laguerre Oscillator signals in a form of the histogram bars, but also in an unusual way. These histogram bars are plotted into some kind of channel. Generally speaking, green bars represent an oversold market state and opportunity for a long trade (buy). Similarly, red bars represent […]
Ehlers Histogram Oscillator Indicator
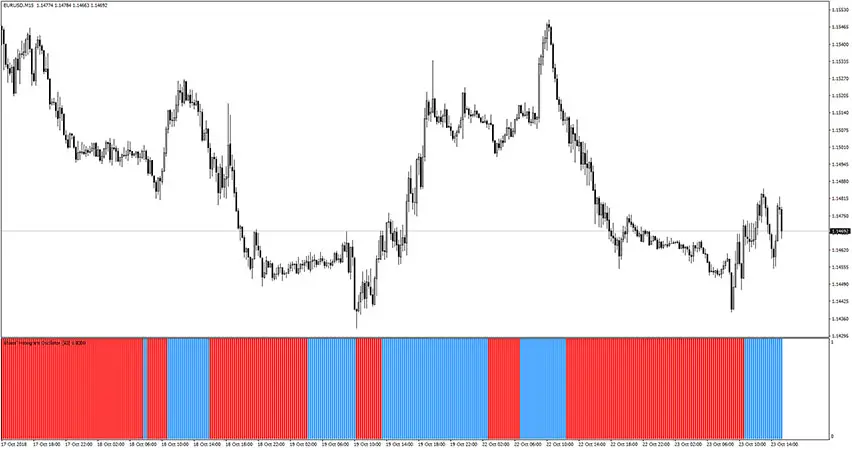
The Ehlers Histogram Oscillator indicator, as the name suggests, shows Ehlers signals in the form of histogram bars. These signals are really easy to read: simply the blue bars mean opportunities for buy trades, and the red bars mean opportunities for sell trades. The EHO can work as a filter for trade entries and exits.
MFI RSI Divergence Indicator
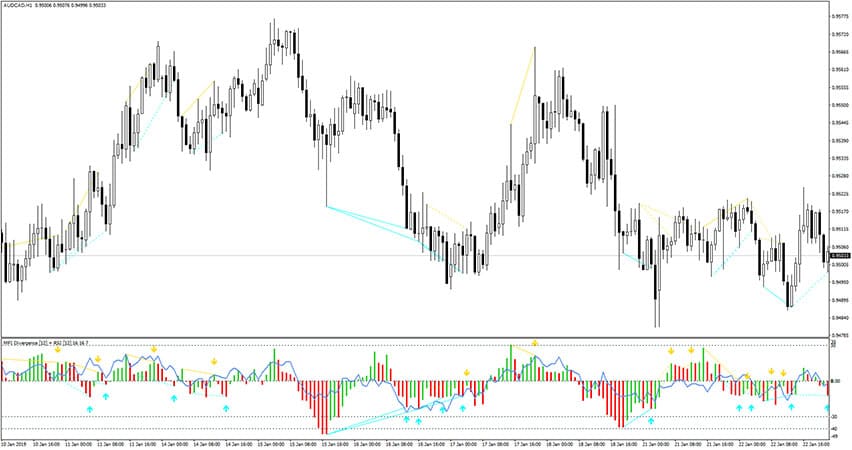
The MFI RSI Divergence indicator is a forex tool based on Money Flow Index and Relative Strenght Index. It recognizes, spots, and displays divergence. Additionally, it provides buy/sell arrows for bullish and bearish divergences. We suggest using it for entries and exit ideas or as a filter in your favorite trading strategy.
Chimp Indicator MT4
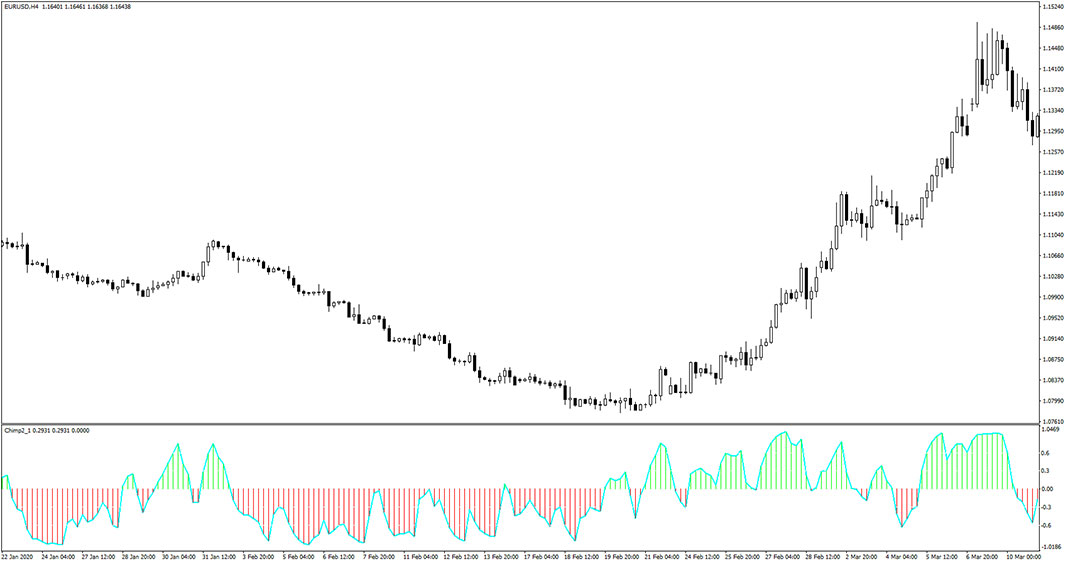
The Chimp Indicator for MT4 is scalping and intraday trading tool, which presents its signals in the form of a colored histogram. Example chart: How to use the Chimp Indicator for MT4? The Chimp Indicator is displayed in MetaTrader 4 in a separate window placed just below the main candlesticks chart. The green and red […]
TrendlessOS Histogram Indicator
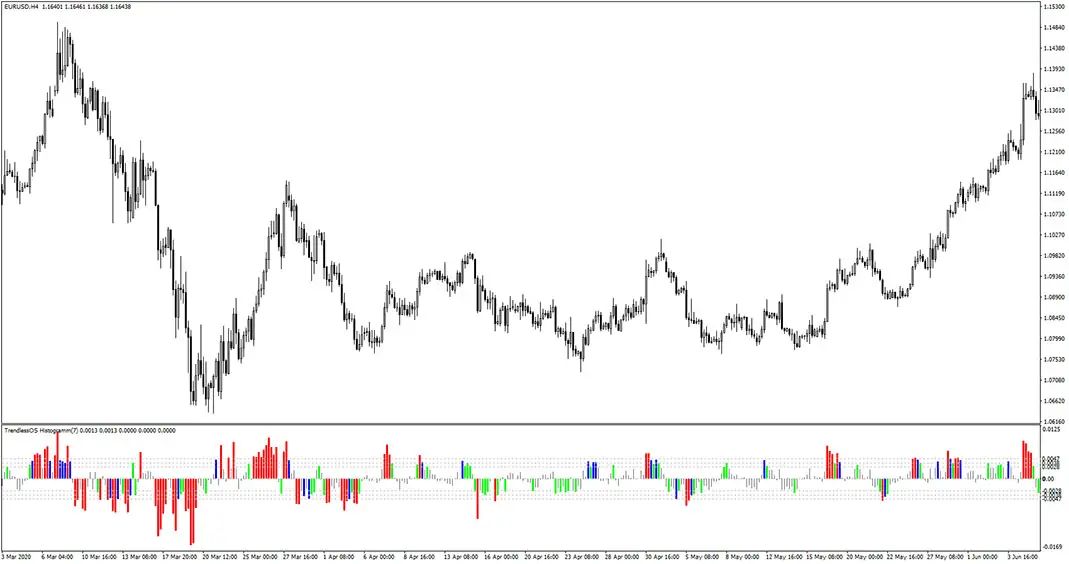
The TrendlessOS Histogram Indicator for MT4 provides gray and colorful readings based on price movements. When you see a green, red or blue bar exceeding the overbought or oversold level defined by dotted lines – it means a high-probality market reversal in underway. The best use case for this tool is combination with other technical […]
Scalper Dream Indicator

The Scalper Dream Indicator is a all-in-one forex trading gauge. It recognizes trend direction, measures trend strength and displays momentum histogram bars. Most of these essential data is provided in the top left part of the chart, however histogram is displayed below it. How does it work? How to apply in trading? Buy Entry: Open […]
MATWO Indicator

The MATWO is a custom forex trading indicator based on the moving averages. When the signal line crosses the zero line, you should expect the price to move in the direction of the intersection. The formation of a top or a bottom represents a probable reverse or a correction. These kinds of intersections and formations […]
Ary Aind Indicator
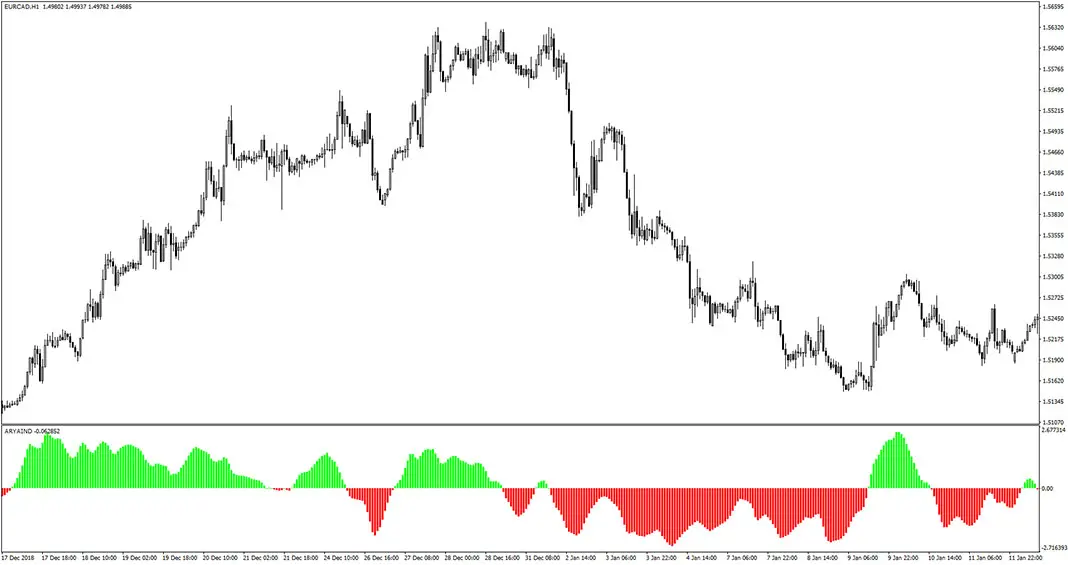
The Ary Aind Indicator acts and works in a similar manner to the Moving Average Convergence Divergence (MACD) indicator. The readings can be considered as momentum. As a rule of thumb, the green bars correspond to bullish setup and red bars reflect bearish scenario. Please note, that this indicator is repainting. Example chart:
Ehlers Fisher Transform MTF Indicator
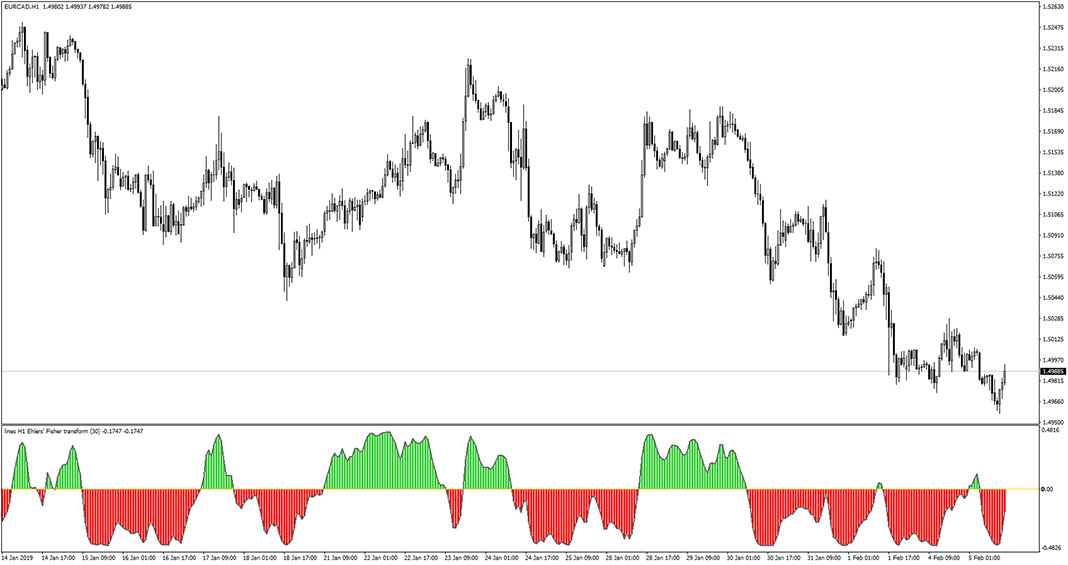
The Ehlers Fisher Transform MTF Indicator for MT4 is a popular tool for detecting ongoing market trends and also reversal points. The approach is pretty simple – green histogram bars correspond to bullish setup and red bars reflect bearish scenario. The moment when these readings switch is a trigger for potential and high-probabality reversal. Example […]
iAnchMom Indicator
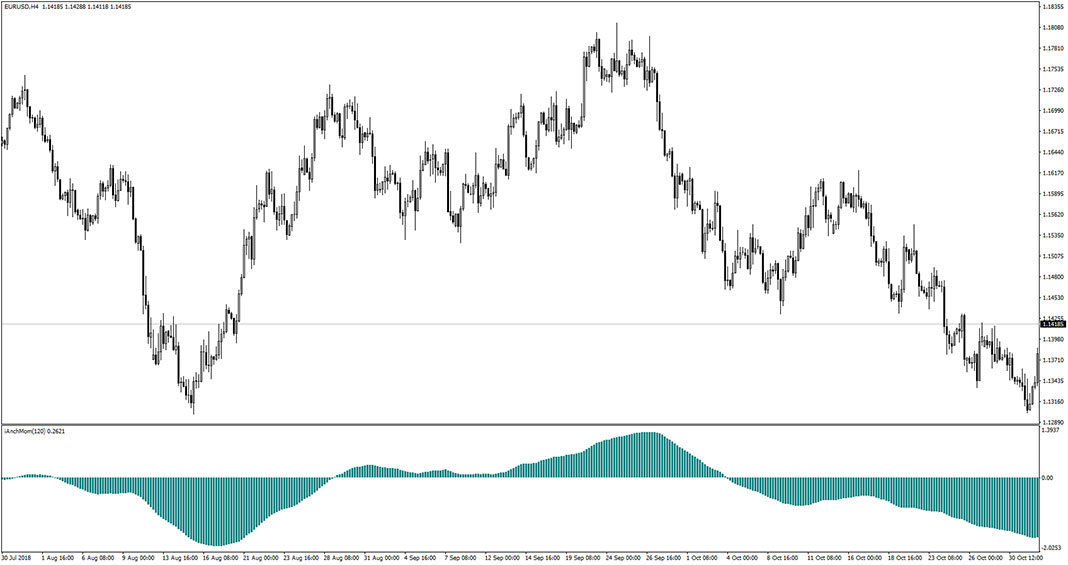
The iAnchMom indicator for MT4 comes in handy in recognizing overall market direction and for the calculations it uses SMA and MOM. It displays histogram bars and visually it is simialar the MACD. The readings above 0 level corresponds to bullish trend, and similarly, readings below 0 level suggest bearish trend. It’s best use case […]
