Tag: histogram indicators
Candle Average V3 Indicator

Introduction to the Candle Average V3 Indicator The Candle Average V3 indicator uses a custom formula to calculate values and displays them in the form of histogram bars. When these bars take positive values (above 0) a trader should be looking for buy opportunities. Similarly, when these bars take negative values (below 0) a trader […]
Glitch Index Indicator
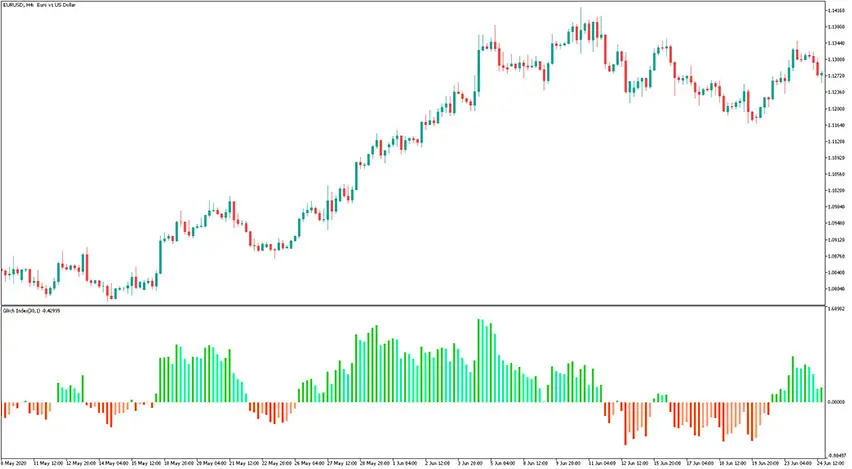
Introduction to the Glitch Index Indicator The Glitch Index indicator is a custom forex histogram indicator that shows the index of the price deviation from its average value. That gauge was first introduced in the February edition of Active Trader Magazine in the year 2004. Since then, it has continued to gain popularity and support […]
RSI Divergence Candles Indicator
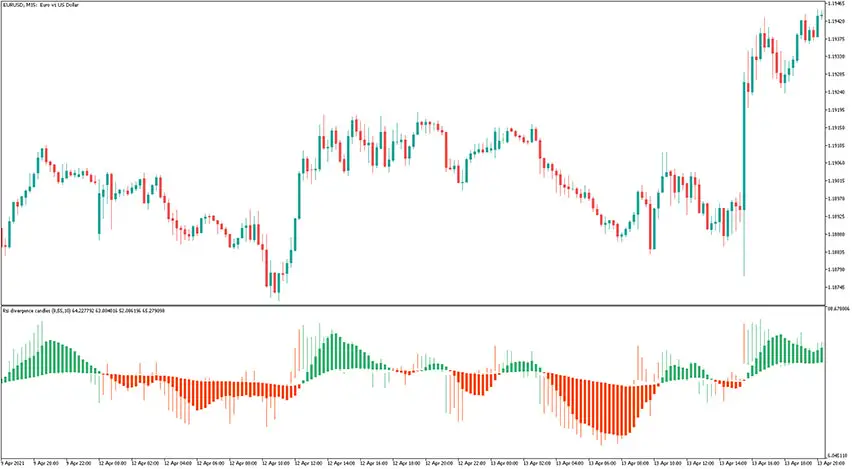
Introduction to the RSI Divergence Candles Indicator The RSI Divergence Candles Indicator is a momentum oscillator that measures the speed and change of price movements. The signals are shown in the form of candles that are colored differently in a manner that gives traders plenty of information about market trends and their directions. The foundation […]
Three Moving Averages Convergence/Divergence (MAxCD) Indicator
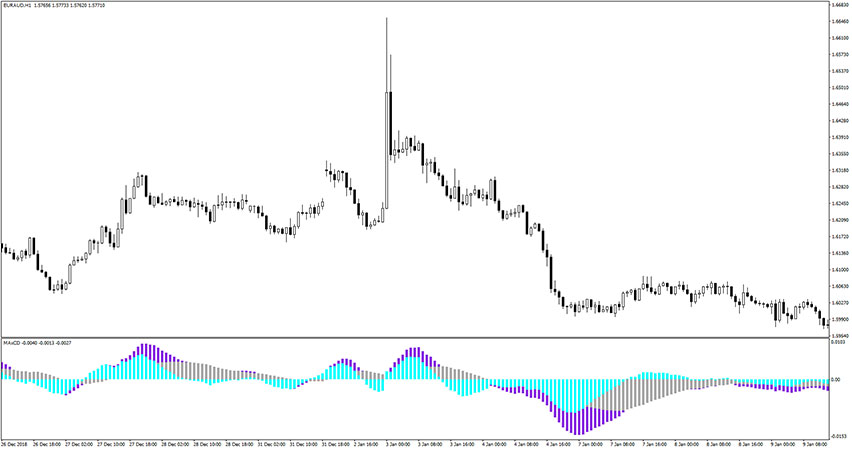
Introduction to the Three Moving Averages Convergence/Divergence (MAxCD) Indicator The Three Moving Averages Convergence/Divergence (MAxCD) indicator also known as MAxCD, is a signal oscillator that consists of three moving averages. This forex indicator draws three colored histogram bars that float above and below the zero level. Each color of the histogram bar represents each moving […]
Laguerre Histogram Indicator
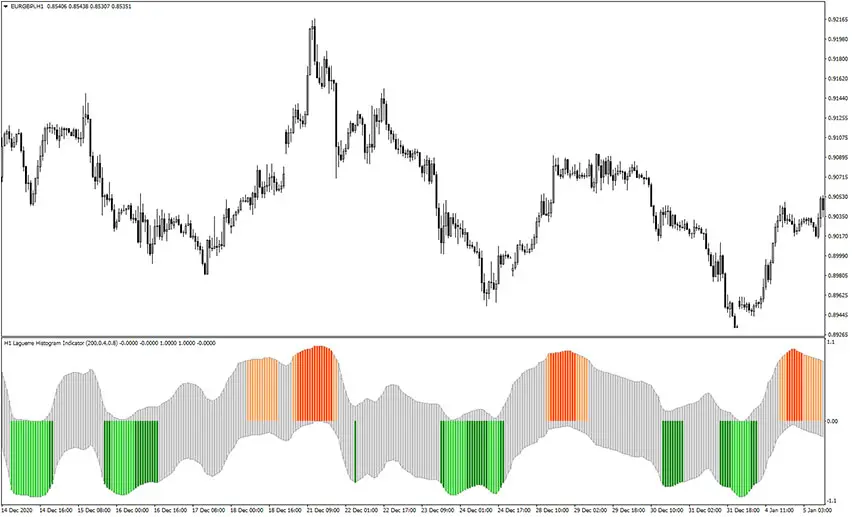
Introduction to the Laguerre Histogram Indicator The Laguerre Histogram indicator, as the name suggests, displays Laguerre Oscillator signals in a form of the histogram bars, but also in an unusual way. These histogram bars are plotted into some kind of channel. Generally speaking, green bars represent an oversold market state and opportunity for a long […]
Ehlers Histogram Oscillator Indicator
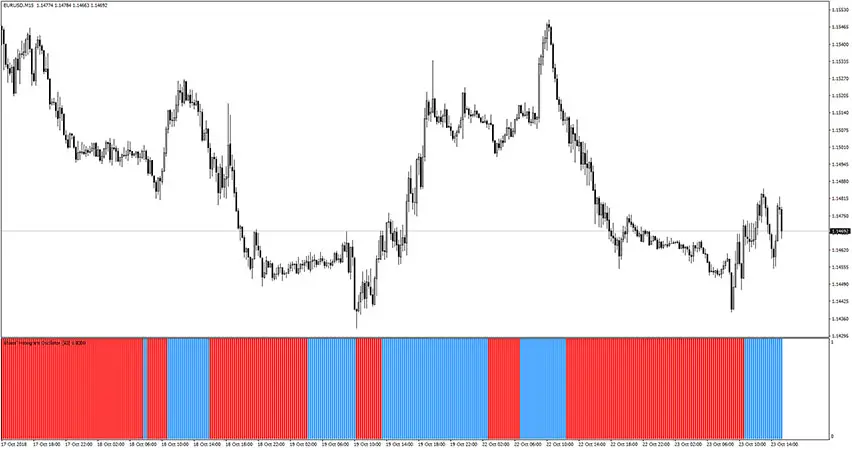
Introduction to the Ehlers Histogram Oscillator Indicator The Ehlers Histogram Oscillator indicator, as the name suggests, shows Ehlers signals in the form of histogram bars. These signals are really easy to read: simply the blue bars mean opportunities for buy trades, and the red bars mean opportunities for sell trades. The EHO can work as […]
MFI RSI Divergence Indicator
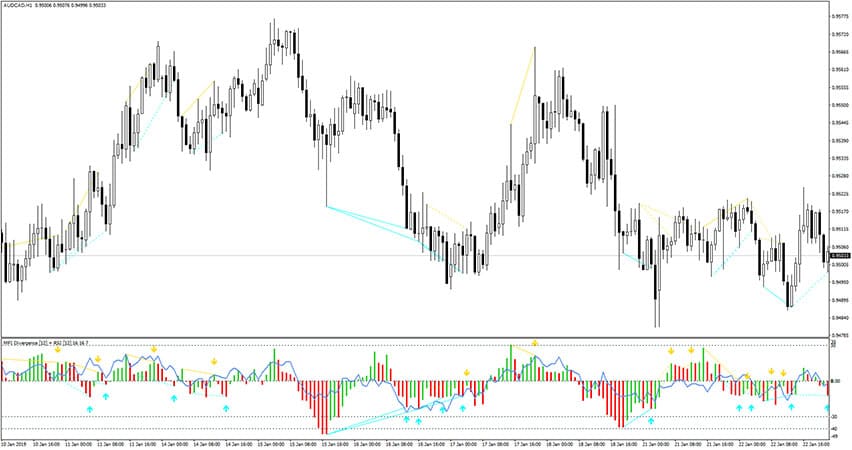
Introduction to the MFI RSI Divergence Indicator The MFI RSI Divergence indicator is a forex tool based on Money Flow Index and Relative Strenght Index. It recognizes, spots, and displays divergence. Additionally, it provides buy/sell arrows for bullish and bearish divergences. We suggest using it for entries and exit ideas or as a filter in […]
Chimp Indicator
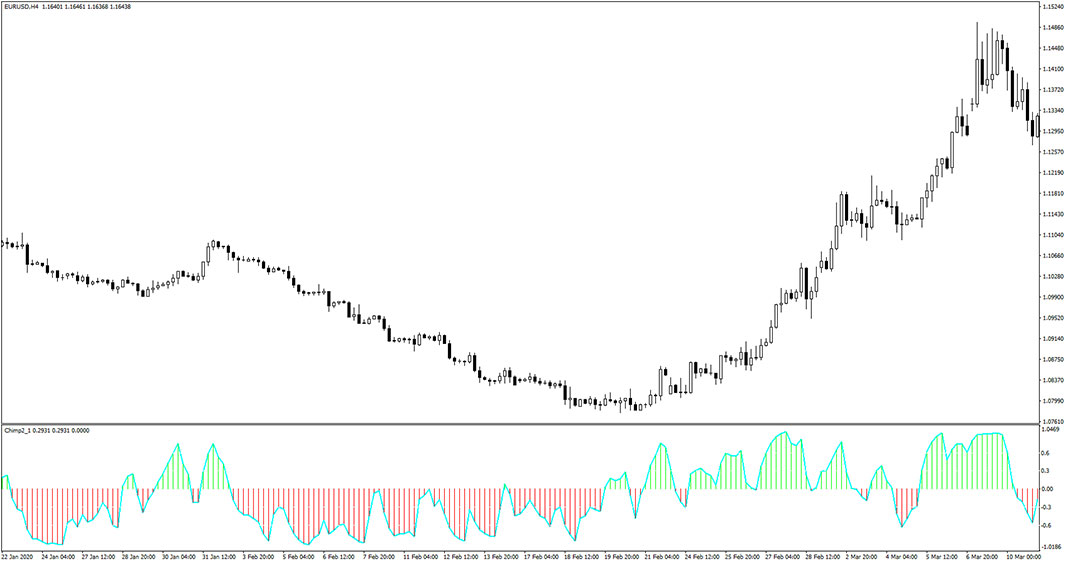
Introduction to the Chimp Indicator The Chimp Indicator is a custom forex trading tool that presents its signals in the form of a histogram. The indicator is displayed in a separate window placed just below the main trading chart. The green and red bars move in above and below 0 level and you should trade […]
TrendlessOS Histogram Indicator
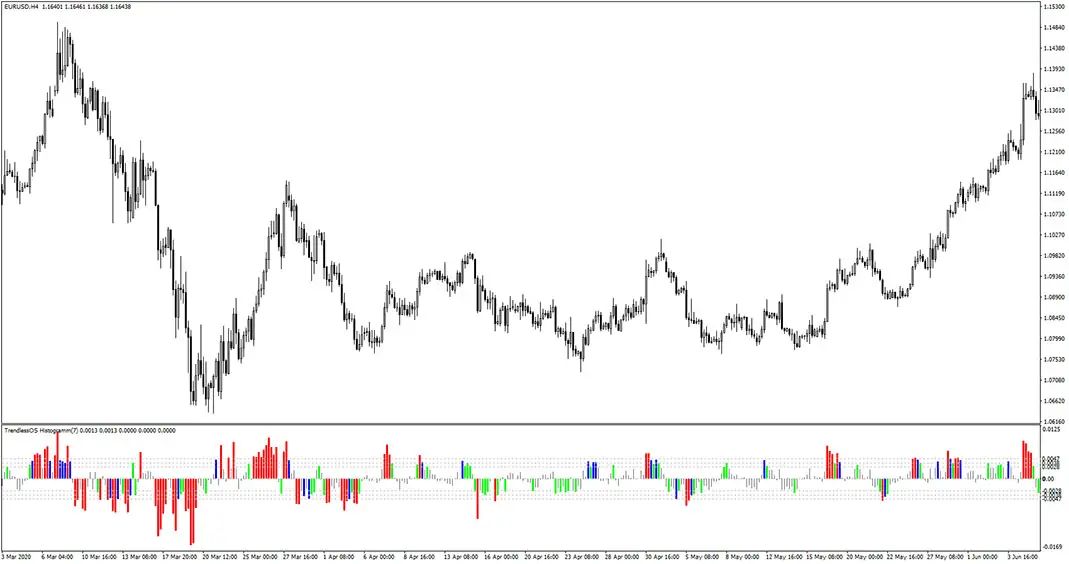
Introduction to the TrendlessOS Histogram Indicator The TrendlessOS Histogram Indicator is a custom forex trading tool presented in the form of a histogram. The indicator is displayed in a separate window placed just below the main trading chart. We suggest to use it as a filter for opening and exiting transactions. Go ahead and add […]
Scalper Dream Indicator

Introduction to the Scalper Dream Indicator The Scalper Dream Indicator is a custom forex trading indicator that provides trend-following buy and sell histogram bars. The indicator is displayed in a separate window placed just below the main trading chart. It fits all kinds of timeframes and currency pairs. The default indicator settings can be modified […]