Category: Forex MT5 Indicators
Bollinger Bands Color Indicator
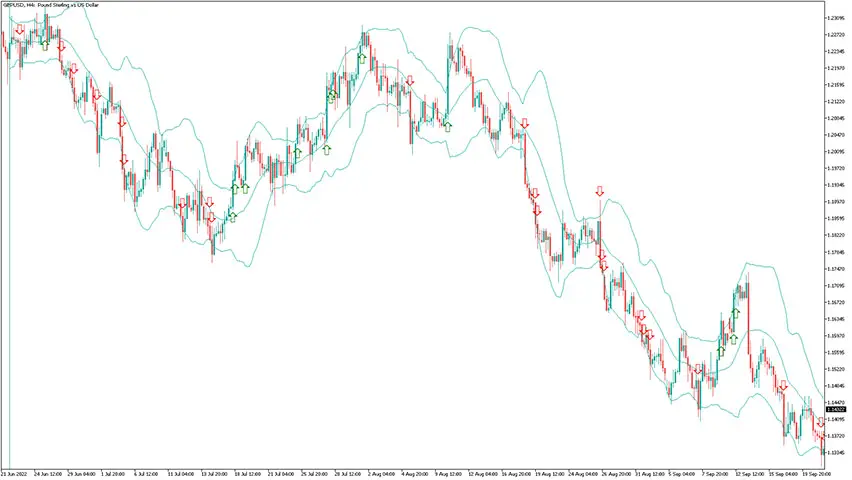
The Bollinger Bands Color Indicator for MT5 not only helps to understand ongoing market volatility, but also marks different setups with distinct colors. Forex traders equipped with such readings, can act faster regarding bearish, bullish opportunities and also know when there is a neutral movement. Example chart: Understanding readings of the bollinger bands color indicator […]
Market Sessions Indicator
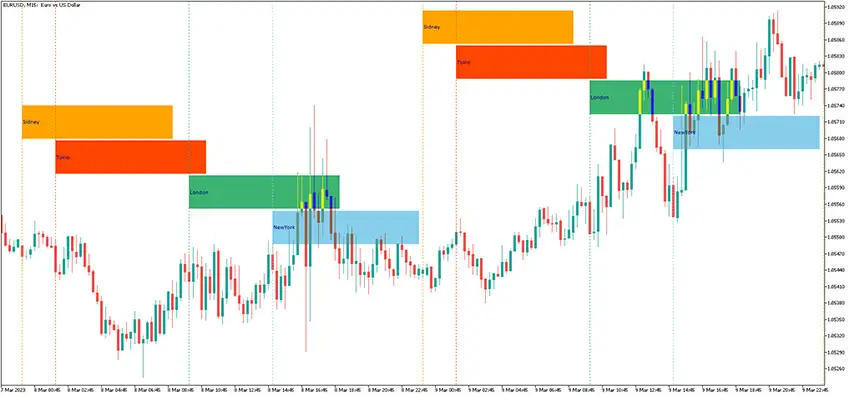
The Market Sessions Indicator for MT5 displays separate forex trading sessions and it’s available to free download. What’s more, it also shows the maximum and minimum prices of the preceding market session. Trading conditions are more favorable during certain sessions, which are marked by higher market liquidity. Understanding market sessions As you can see, that […]
Candle Time And Spread Indicator
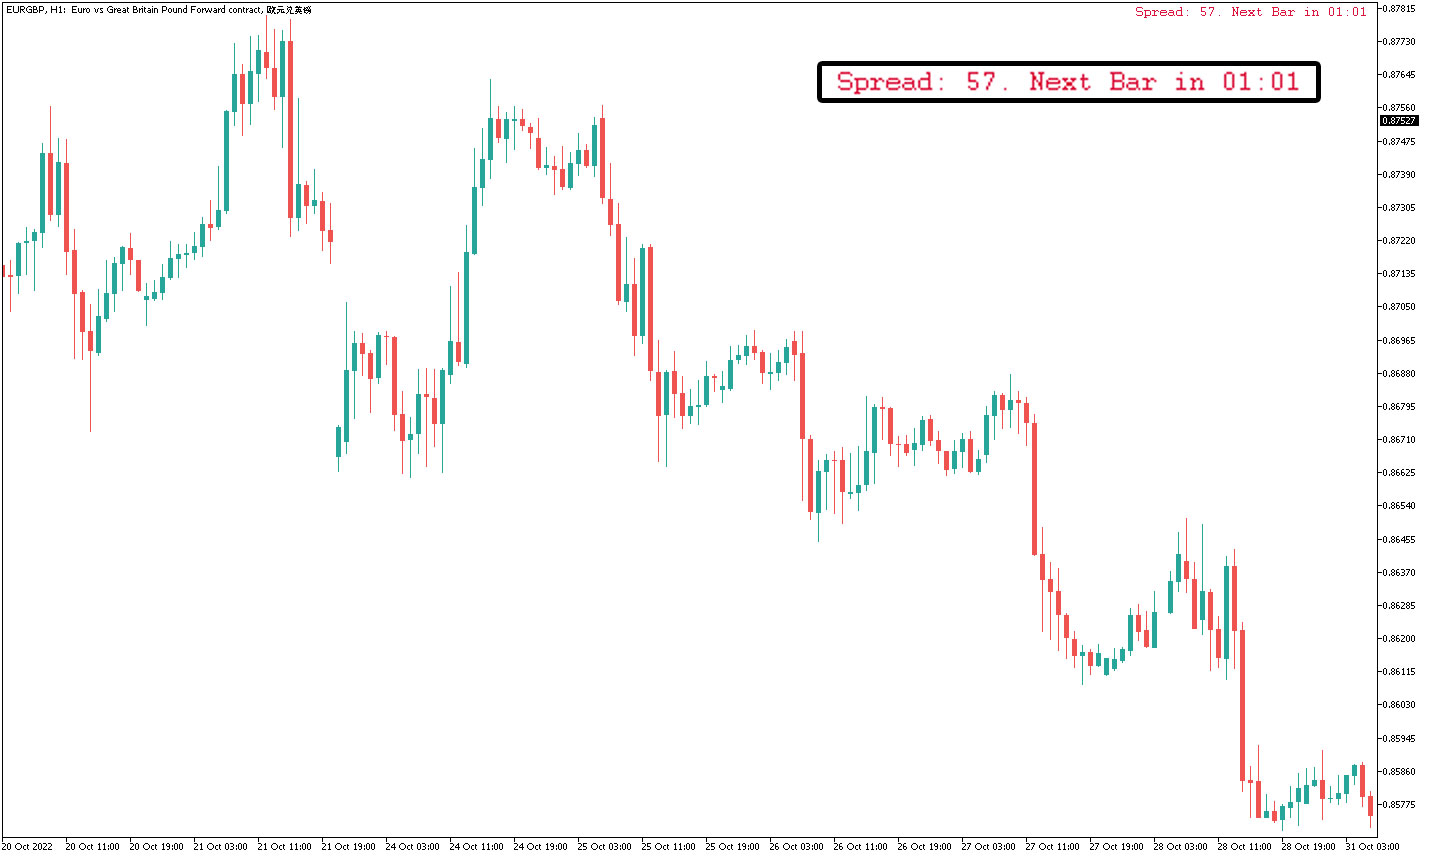
The Candle Time And Spread Indicator is a useful informational tool that displays the time left to the bar end and the current spread in real-time. It is a great supplementary gauge in a trading endeavor. Example charts Check charts of the Candle Time And Spread Indicator in action. Settings There are available settings: the […]
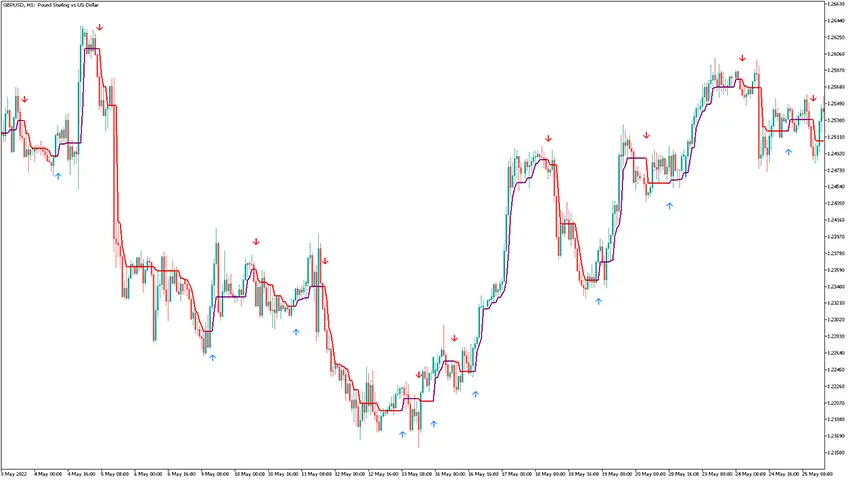
JF Engulfing Candle Indicator
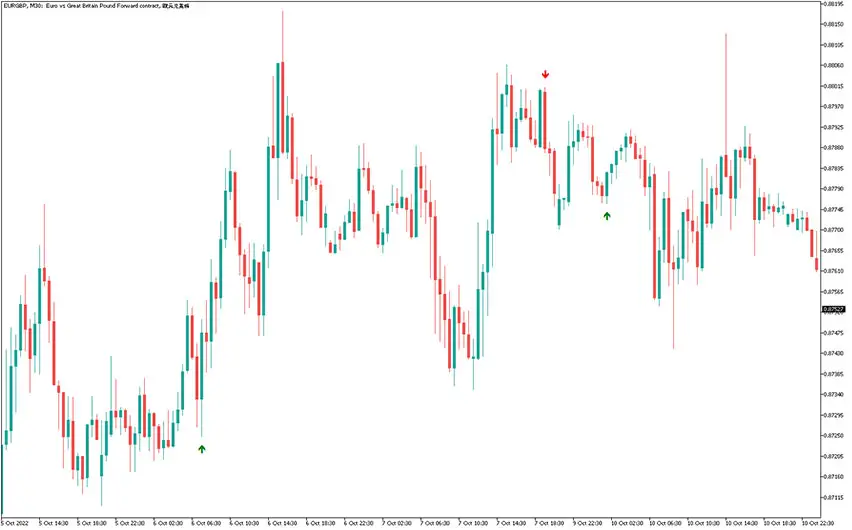
The JF Engulfing Candle Indicator is an accurate tool for spotting engulfing patterns on charts. Very often, when an engulfing candle appears, it is a sign of a trend reversal, which you can take advantage of. The gauge displays buy/sell arrows when a signal happens. How to apply the JF engulfing candle pattern? As the […]
Bollinger Bands Cross Alert Indicator
The Bollinger Bands Cross Alert Indicator offers an alert when the price is out of the Bollinger Bands range, indicating a possible price direction change. The indicator was originally created by Issam Kassas (DFXG – Dubai Forex Group). Example charts Check charts of the Bollinger Bands Cross Alert Indicator in action. Settings These are available […]
Donchian Channel Indicator

The Donchian Channel Indicator for MT5 is a volatility indicator that uses the calculation of the current price range with the help of the recent highest and lowest price levels of an asset. To perform the calculation for the Channel, the gauge needs to find the highest maximum and the lowest minimum for a defined […]
MACD Histogram Multi-Color Indicator
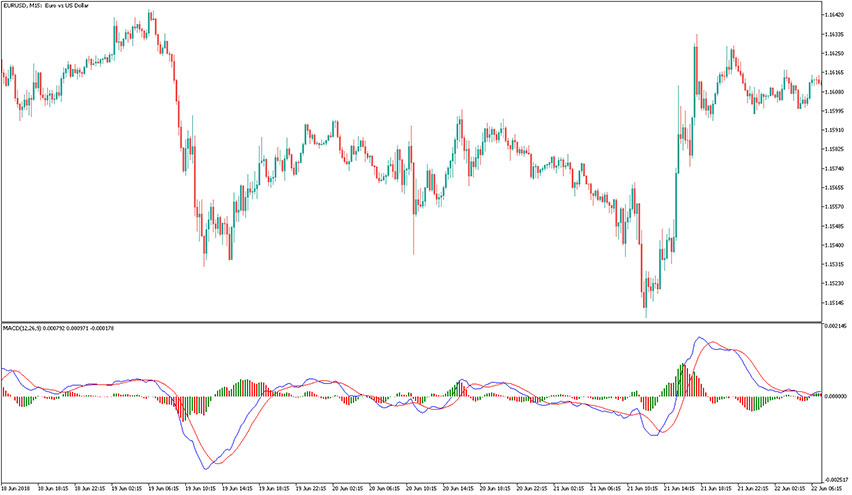
The MACD Histogram Multi-Color Indicator for MT5 shows the difference between the MACD and Signal Lines. For the calculation of the MACD line, you can choose from the usual price types. For the calculation of the Signal Line, you can choose between SMA or EMA. The histogram can be switched between single and multi-color. Example […]
Xmaster Formula Indicator MT5
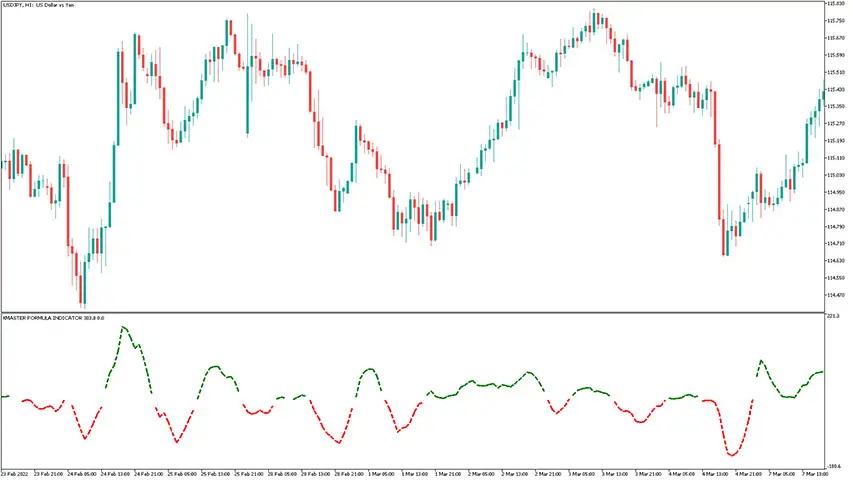
The Xmaster Formula Indicator for MT5 displays a bi-colored dashed line that shows market trends and their directions. It’s often referred to as the xhmaster formula. This tool is a modern version of a popular indicator known for providing reliable and accurate signals, originally released for earlier MetaTrader platform. How to trade with the Xmaster […]
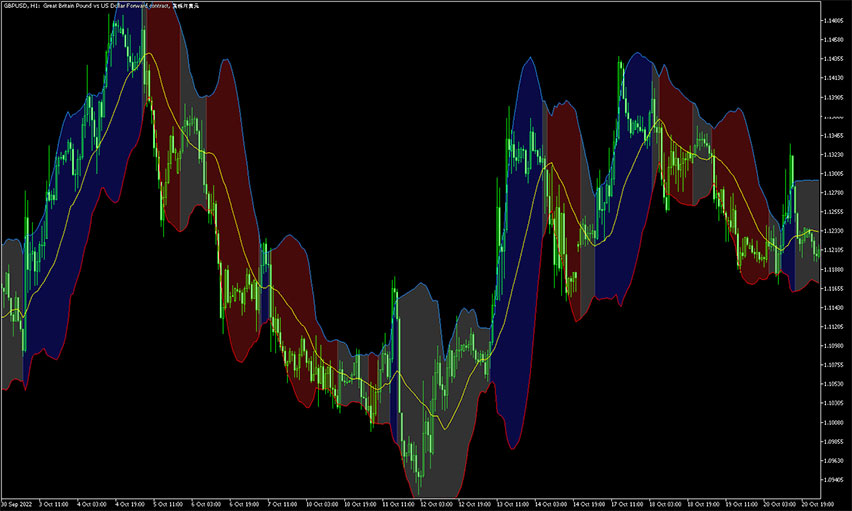
Relative Volatility Index Indicator MT5
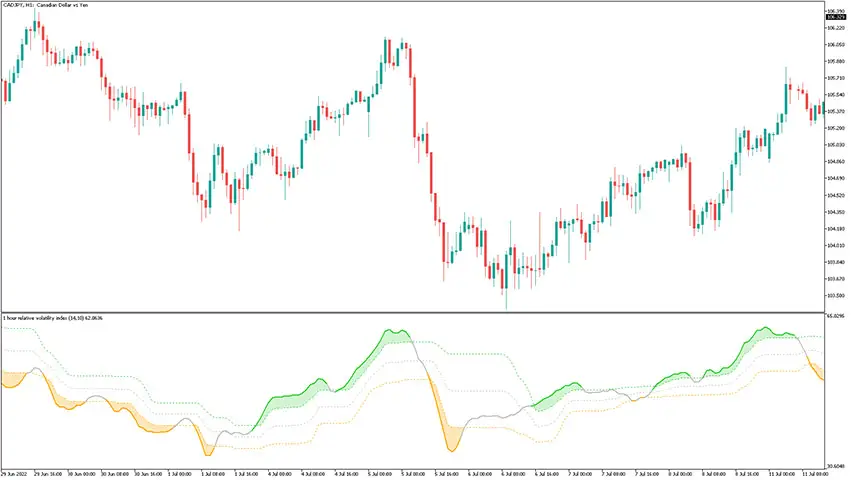
The Relative Volatility Index Indicator for MT5 consists of two color-filled floating areas which suggest whether the current volatility is bullish or bearish. The indicator is originally coded to support multi-time frame analysis and provides alerts. Example chart: How to use the relative volatility index indicator for mt5? When the floating area is greenish – […]
Half Trend Buy Sell Indicator
The Half Trend Buy Sell Indicator for MT5 is a trend-following and non-repainting forex trading gauge. Its signals are calculated and provided in a totally automatic way and are based on moving averages intersections. It’s a newbie-friendly tool as these signals are presented in the form of simple buy/sell arrows. Nonetheless, signal reliability is really […]