Category: Forex MT5 Indicators
Linear Regression Channel Indicator

The Linear Regression Channel Indicator for MT5 is responsible for placing five leaning lines that together form an channel. They are calculated based on the maximum deviation. The most external ones define boundries and limits of price, you can consider them as support and resistance levels. What’s more, the slope suggests the trend direction. In […]
Fractal Support and Resistance Indicator MT5

The Fractal Support and Resistance Indicator for MT5 is responsible for drawing multiple horizontal lines. These levels are calculated based on fractals, which means using local high and low points in given period. The support and resistance lines define the boundaries within which the price moves most of the time, however sooner or later a […]
Darvas Boxes NMC Indicator MT5

The Darvas Boxes NMC Indicator for MT5 draws squares and rectangles on activity chart. These shapes have special meaning as their right edges act as potential trade entry points. What’s more, the formula behind this tool allowed its creator to amass a considerable fortune. A little bit of historical background Nicolas Darvas developed his unique […]
Order Block Locator Indicator
The Order Block Locator Indicator for MT5 offers superior buy and sell signals within the forex market, pinpointing them by analyzing price exhaustion points. These order blocks represent regions where substantial orders have been executed, a result of participation from various significant market players, including banks, hedge funds, and other financial institutions. Order Block Locator […]
Chandelier Exit Cloud Indicator MT5
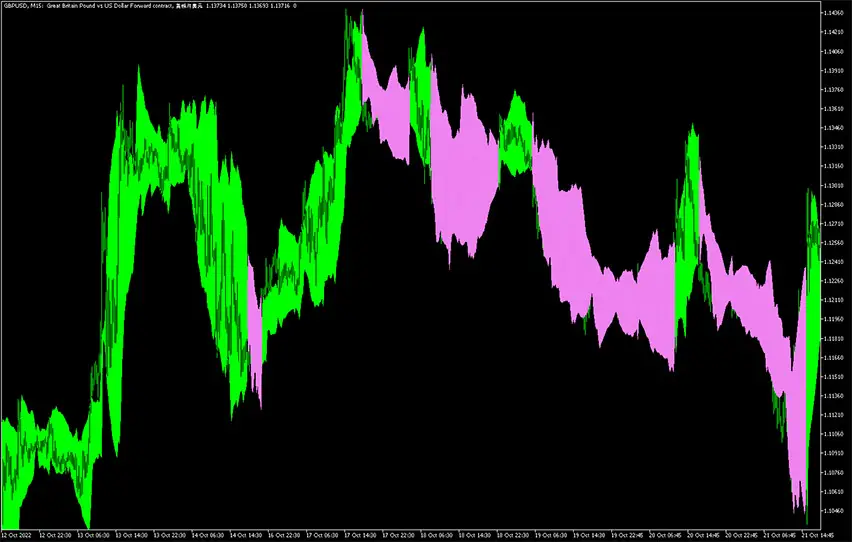
The Chandelier Exit Cloud Indicator for MT5 performs analysis of price movements and in the result provides specific trend display. Essentially, this guage shows signals in the form of a colorful cloud. To be precise, there are green and pink formations that correspond to bullish and bearish market bias. This can be utilized in several […]
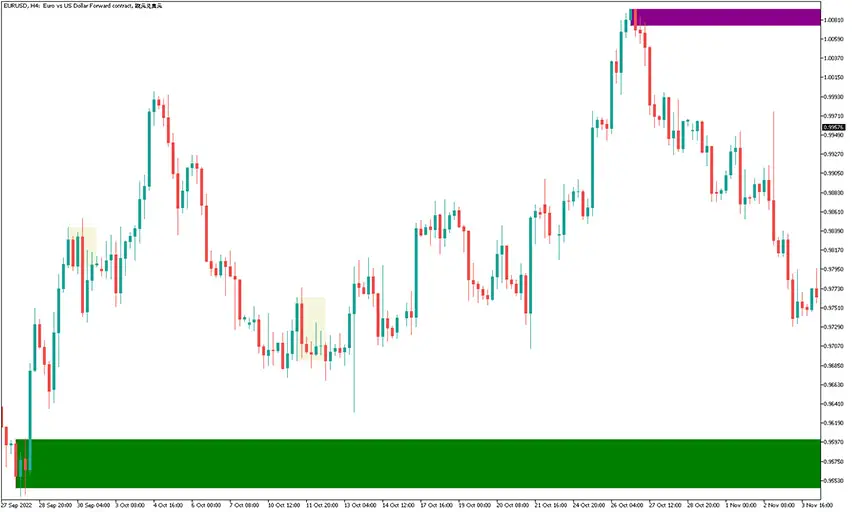
Breakout Zones Indicator
Goal of the Breakout Zones Indicator for MT5 is scanning charts for the special zones with high-probability opportunities. These levels are displayed in the form of two horizontal lines serving as reference points for the potential trades. What’s more, they are both based on specific time interval, thus apply only for a specific slice of […]
Prevailing Trend Indicator MT5
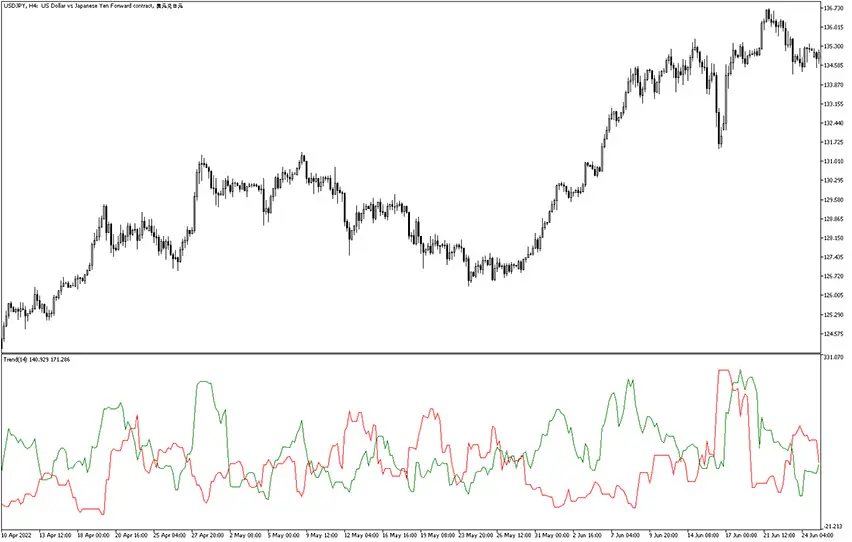
The Prevailing Trend Indicator for MT5 simply reflects the current trend by two distinct lines. These so-called components and their setup has specific meaning, namely red one suggests bearish scenario, while the green one corresponds to bullish market. The trade signals occurs when they cross each other. Example chart: How to use the prevailing trend […]
Averages Heatmap Indicator
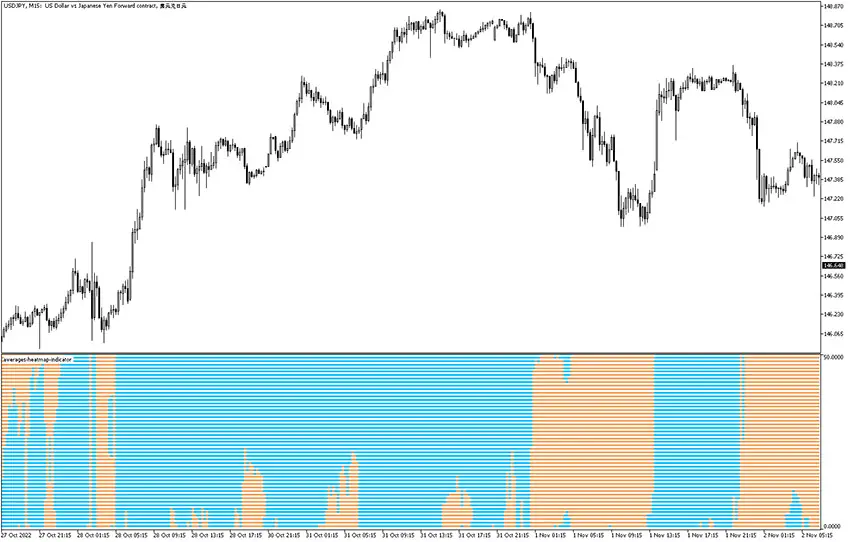
The Averages Heatmap Indicator for MT5 is essentially a combination of multiple moving averages giving wide perspective on market situation. It can be successfully used for determining trend strenght and direction or even stop loss and take profit levels. When you activate the gauge, it will be displayed within own window placed below main trading […]
Double Stochastic With RSI Indicator
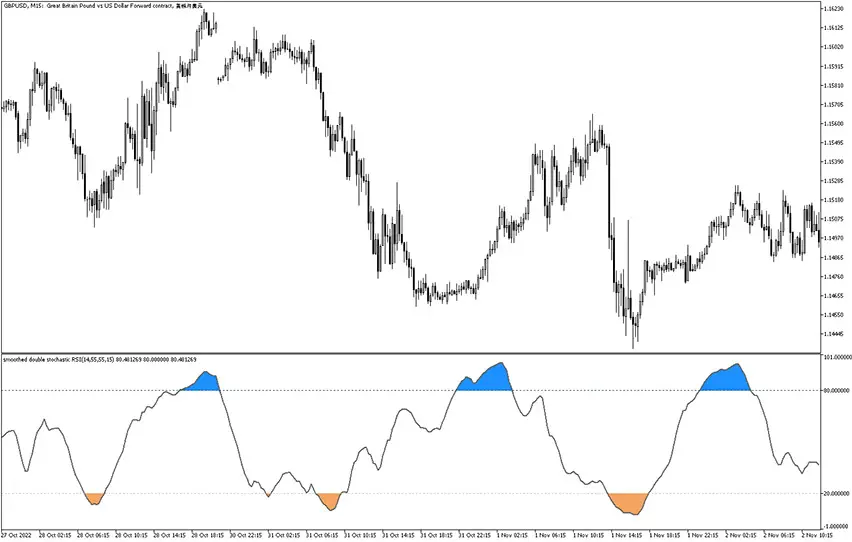
The Double Stochastic With RSI Indicator for MT5 is an interesting combination of these two popular oscillators that are by many considered the best reversal gauges. Its main principle is comparing previous and current values of the readings. The final calculations are pleasantly displayed on the charts with clear overbought and oversold areas. The idea […]
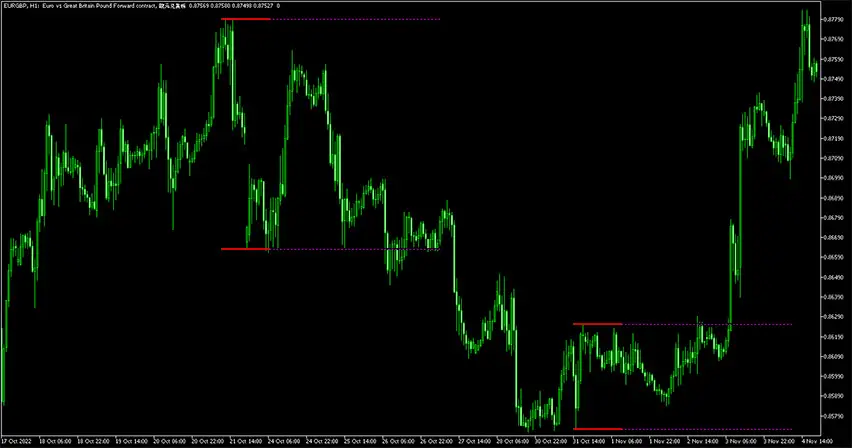
ATR Support/Resistance Levels Indicator
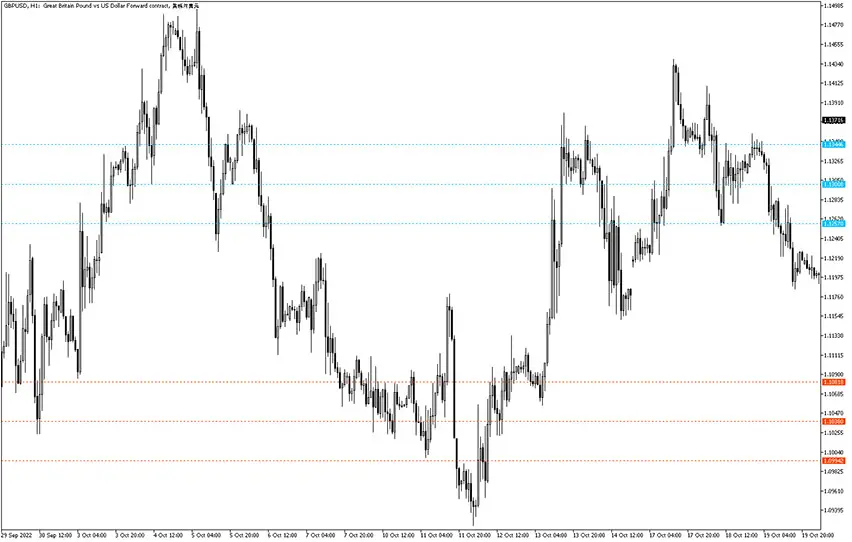
The ATR Support/Resistance Levels Indicator for MT5 uses, as the name suggests, the Average True Range to define three precise support and resistance levels on trading charts. The goal of this tool is identification of key areas at which there is high-probability of strong market reactions. Levels of higher importance explained The formula behind this […]